Supercuts 2005 Annual Report Download - page 36
Download and view the complete annual report
Please find page 36 of the 2005 Supercuts annual report below. You can navigate through the pages in the report by either clicking on the pages listed below, or by using the keyword search tool below to find specific information within the annual report.-
 1
1 -
2
-
3
-
4
-
5
-
6
-
7
-
8
-
9
-
10
-
11
-
12
-
13
-
14
-
15
-
16
-
17
-
18
-
19
-
20
-
21
-
22
-
23
-
24
-
25
-
 26
26 -
 27
27 -
 28
28 -
 29
29 -
 30
30 -
 31
31 -
 32
32 -
 33
33 -
 34
34 -
 35
35 -
 36
36 -
 37
37 -
 38
38 -
 39
39 -
 40
40 -
 41
41 -
 42
42 -
 43
43 -
 44
44 -
 45
45 -
 46
46 -
47
-
48
-
49
-
50
-
51
-
52
-
53
-
54
-
55
-
56
-
57
-
58
-
59
-
60
-
61
-
62
-
63
-
64
-
65
-
66
-
67
-
68
-
69
-
70
-
71
-
72
-
73
-
74
-
75
-
76
-
77
-
78
-
79
-
80
-
81
-
82
-
83
-
84
-
85
-
86
-
87
-
88
-
89
-
90
-
91
-
92
-
93
-
94
-
95
-
96
-
97
-
98
-
99
-
100
-
101
-
102
-
103
-
104
-
105
-
106
-
107
-
108
-
109
-
110
-
111
-
112
-
113
-
114
-
115
-
116
-
117
-
118
-
119
-
120
-
121
 |
 |

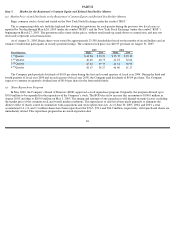
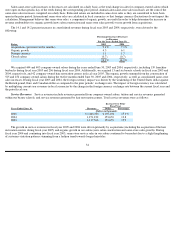
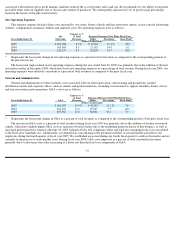
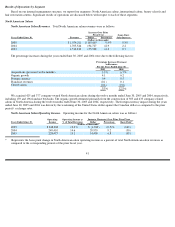
Product Revenues. Product revenues are primarily comprised of retail sales at company-
owned salons, sales of product and equipment to
franchisees, and retail product sales made by our beauty schools and hair restoration centers. Total product revenues were as follows:
Fiscal year 2005 product revenue percentage increases were not as robust as the prior fiscal year primarily due to lower same-store
product sales increases in our company-owned salons. The large increase in same-store product sales during fiscal year 2004 was primarily
driven by a trend towards sales of higher priced beauty tools, such as flat irons and the introduction of the Matrix product line to Trade Secret
salons.
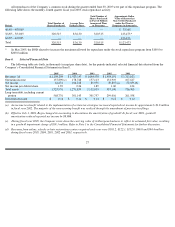
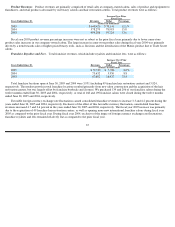
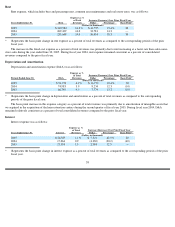
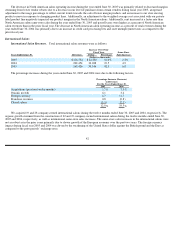
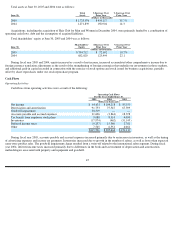
Franchise Royalties and Fees. Total franchise revenues, which include royalties and franchise fees, were as follows:
Total franchise locations open at June 30, 2005 and 2004 were 3,951 (including 49 franchise hair restoration centers) and 3,924,
respectively. The modest growth in total franchise locations resulted primarily from new salon construction and the acquisition of the hair
restoration centers, but was largely offset by franchise buybacks and closures. We purchased 139 and 206 of our franchise salons during the
twelve months ended June 30, 2005 and 2004, respectively. A total of 168 and 190 franchise salons were closed during the twelve months
ended June 30, 2005 and 2004, respectively.
Favorable foreign currency exchange rate fluctuations caused consolidated franchise revenues to increase 3.3 and 6.2 percent during the
years ended June 30, 2005 and 2004, respectively. Exclusive of the effect of this favorable currency fluctuation, consolidated franchise
revenues increased 4.7 and 2.6 percent in the years ended June 30, 2005 and 2004, respectively. The fiscal year 2005 increase was primarily
due to the acquisition of 49 franchise hair restoration centers, as well as opening more new international franchise salons during fiscal year
2005 as compared to the prior fiscal year. During fiscal year 2004, exclusive of the impact of foreign currency exchange rate fluctuations,
franchise royalties and fees remained relatively flat as compared to the prior fiscal year.
35
Increase Over Prior
Fiscal Year
Years Ended June 30,
Revenues
Dollar
Percentage
(Dollars in thousands)
2005
$
648,420
$
70,141
12.1
%
2004
578,279
78,993
15.8
2003
499,286
59,724
13.6
Increase Over Prior
Fiscal Year
Years Ended June 30,
Revenues
Dollar
Percentage
(Dollars in thousands)
2005
$
79,538
$
5,906
8.0
%
2004
73,632
5,950
8.8
2003
67,682
16,937
33.4