Supercuts 2005 Annual Report Download - page 56
Download and view the complete annual report
Please find page 56 of the 2005 Supercuts annual report below. You can navigate through the pages in the report by either clicking on the pages listed below, or by using the keyword search tool below to find specific information within the annual report.-
 1
1 -
2
-
3
-
4
-
5
-
6
-
7
-
8
-
9
-
10
-
11
-
12
-
13
-
14
-
15
-
16
-
17
-
18
-
19
-
20
-
21
-
22
-
23
-
24
-
25
-
26
-
27
-
28
-
29
-
30
-
31
-
32
-
33
-
34
-
35
-
36
-
37
-
38
-
39
-
40
-
41
-
42
-
43
-
44
-
45
-
 46
46 -
 47
47 -
 48
48 -
 49
49 -
 50
50 -
 51
51 -
 52
52 -
 53
53 -
 54
54 -
 55
55 -
 56
56 -
 57
57 -
 58
58 -
 59
59 -
 60
60 -
 61
61 -
 62
62 -
 63
63 -
 64
64 -
 65
65 -
 66
66 -
67
-
68
-
69
-
70
-
71
-
72
-
73
-
74
-
75
-
76
-
77
-
78
-
79
-
80
-
81
-
82
-
83
-
84
-
85
-
86
-
87
-
88
-
89
-
90
-
91
-
92
-
93
-
94
-
95
-
96
-
97
-
98
-
99
-
100
-
101
-
102
-
103
-
104
-
105
-
106
-
107
-
108
-
109
-
110
-
111
-
112
-
113
-
114
-
115
-
116
-
117
-
118
-
119
-
120
-
121
 |
 |

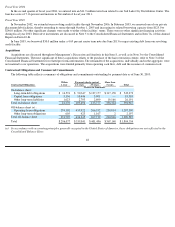
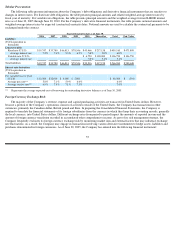
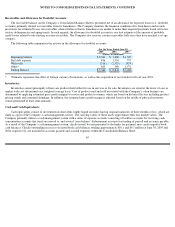
Tabular Presentation:
The following table presents information about the Company’s debt obligations and derivative financial instruments that are sensitive to
changes in interest rates. For fixed rate debt obligations, the table presents principal amounts and related weighted-average interest rates by
fiscal year of maturity. For variable rate obligations, the table presents principal amounts and the weighted-average forward LIBOR interest
rates as of June 30, 2005 through June 30, 2010. For the Company’s derivative financial instruments, the table presents notional amounts and
weighted-average interest rates by expected (contractual) maturity dates. Notional amounts are used to calculate the contractual payments to be
exchanged under the contract.
**
Represents the average expected cost of borrowing for outstanding derivative balances as of June 30, 2005.
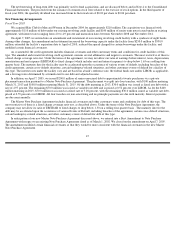
Foreign Currency Exchange Risk:
The majority of the Company’s revenue, expense and capital purchasing activities are transacted in United States dollars. However,
because a portion of the Company’s operations consists of activities outside of the United States, the Company has transactions in other
currencies, primarily the Canadian dollar, British pound and Euro. In preparing the Consolidated Financial Statements, the Company is
required to translate the financial statements of its foreign subsidiaries from the currency in which they keep their accounting records, generally
the local currency, into United States dollars. Different exchange rates from period to period impact the amounts of reported income and the
amount of foreign currency translation recorded in accumulated other comprehensive income. As part of its risk management strategy, the
Company frequently evaluates its foreign currency exchange risk by monitoring market data and external factors that may influence exchange
rate fluctuations. As a result, the Company may engage in transactions involving various derivative instruments to hedge assets, liabilities and
purchases denominated in foreign currencies. As of June 30, 2005, the Company has entered into the following financial instrument:
55
Expected maturity date as of June 30,
2006
2007
2008
2009
2010
Thereafter
Total
Fair Value
Liabilities
(U.S.$ equivalent in
thousands)
Long
-
term debt:
Fixed rate (U.S.$)
$
19,747
$
33,780
$
66,813
$
78,546
$
43,466
$
217,158
$
459,510
$
473,898
Average interest rate
7.2
%
7.6
%
5.3
%
6.9
%
5.4
%
5.8
%
6.0
%
Variable rate (U.S.$)
$
6,750
$
100,000
$
106,750
$
106,750
Average interest rate
5.2
%
5.1
%
5.1
%
Total liabilities
$
19,747
$
33,780
$
66,813
$
78,546
$
50,216
$
317,158
$
566,260
$
580,648
Interest rate derivatives
(U.S.$ equivalent in
thousands)
Pay variable/receive fixed
(U.S.$)
$
12,500
$
22,000
$
9,000
$
5,000
$
48,500
$
(594
)
Average pay rate**
5.8
%
7.1
%
5.9
%
6.0
%
6.4
%
Average receive rate**
6.9
%
7.9
%
7.1
%
7.1
%
7.4
%