Supercuts 2005 Annual Report Download - page 41
Download and view the complete annual report
Please find page 41 of the 2005 Supercuts annual report below. You can navigate through the pages in the report by either clicking on the pages listed below, or by using the keyword search tool below to find specific information within the annual report.-
 1
1 -
2
-
3
-
4
-
5
-
6
-
7
-
8
-
9
-
10
-
11
-
12
-
13
-
14
-
15
-
16
-
17
-
18
-
19
-
20
-
21
-
22
-
23
-
24
-
25
-
26
-
27
-
28
-
29
-
30
-
 31
31 -
 32
32 -
 33
33 -
 34
34 -
 35
35 -
 36
36 -
 37
37 -
 38
38 -
 39
39 -
 40
40 -
 41
41 -
 42
42 -
 43
43 -
 44
44 -
 45
45 -
 46
46 -
 47
47 -
 48
48 -
 49
49 -
 50
50 -
 51
51 -
52
-
53
-
54
-
55
-
56
-
57
-
58
-
59
-
60
-
61
-
62
-
63
-
64
-
65
-
66
-
67
-
68
-
69
-
70
-
71
-
72
-
73
-
74
-
75
-
76
-
77
-
78
-
79
-
80
-
81
-
82
-
83
-
84
-
85
-
86
-
87
-
88
-
89
-
90
-
91
-
92
-
93
-
94
-
95
-
96
-
97
-
98
-
99
-
100
-
101
-
102
-
103
-
104
-
105
-
106
-
107
-
108
-
109
-
110
-
111
-
112
-
113
-
114
-
115
-
116
-
117
-
118
-
119
-
120
-
121
 |
 |

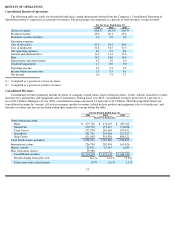
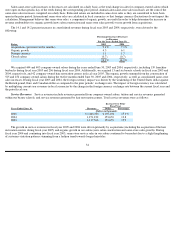
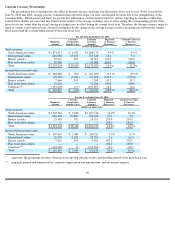
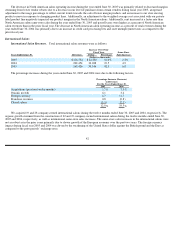
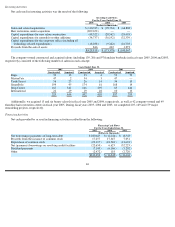
Constant Currency Presentation
The presentation below demonstrates the effect of foreign currency exchange rate fluctuations from year to year. In the years ended
June 30, 2005 and 2004, foreign currency translation had a positive impact on total consolidated revenues due to the strengthening of the
Canadian dollar, British pound and Euro. To present this information, current period results for entities reporting in currencies other than
United States dollars are converted into United States dollars at the average exchange rates in effect during the corresponding period of the
prior fiscal year, rather than the actual average exchange rates in effect during the current fiscal year. Therefore, the foreign currency impact is
equal to current year results in local currencies multiplied by the change in the average foreign currency exchange rate between the current
fiscal period and the corresponding period of the prior fiscal year.
*
represents the percentage increase (decrease over reported amounts in the corresponding period of the prior fiscal year
**
primarily general and administrative, corporate depreciation and amortization, and net interest expense
40
For the Year Ended June 30, 2005
Currency
Constant
Reported
Constant Currency
Reported
Translation
Currency
% Increase
% Increase
Amount
Benefit (Loss)
Amount
(Decrease)*
(Decrease)*
(Dollars in thousands)
Total revenues:
North American salons
$
1,874,211
$
6,032
$
1,868,179
9.9
%
9.5
%
International salons
226,784
13,636
213,148
12.0
5.3
Beauty schools
33,911
597
33,314
123.9
120.0
Hair restoration centers
59,388
—
59,388
100.0
100.0
Total
$
2,194,294
$
20,265
$
2,174,029
14.1
%
13.0
%
Income before income taxes:
North American salons
$
248,080
$
800
$
247,280
(0.5
)%
(0.9
)%
International salons
(18,133
)
(1,100
)
(17,033
)
(180.7
)
(175.8
)
Beauty schools
7,466
203
7,263
43.2
39.3
Hair restoration centers
12,264
—
12,264
100.0
100.0
Corporate**
(133,220
)
(13
)
(133,207
)
16.6
16.6
Total
$
116,457
$
(110
)
$
116,567
(28.5
)%
(28.4
)%
For the Year Ended June 30, 2004
Currency
Constant
Reported
Constant Currency
Reported
Translation
Currency
% Increase
% Increase
Amount
Benefit (Loss)
Amount
(Decrease)*
(Decrease)*
(Dollars in thousands)
Total revenues:
North American salons
$
1,705,546
$
7,800
$
1,697,746
12.9
%
12.4
%
International salons
202,454
19,826
182,628
19.5
7.8
Beauty schools
15,143
792
14,351
253.4
234.9
Hair restoration centers
—
—
—
100.0
100.0
Total
$
1,923,143
$
28,418
$
1,894,725
14.2
%
12.5
%
Income before income taxes:
North American salons
$
249,410
$
1,089
$
248,321
9.2
%
8.7
%
International salons
22,479
2,228
20,251
3.6
(6.7
)
Beauty schools
5,215
294
4,921
407.3
378.7
Hair restoration centers
—
—
—
100.0
100.0
Corporate**
(114,265
)
(2
)
(114,263
)
(0.1
)
(0.1
)
Total
$
162,839
$
3,609
$
159,230
19.1
%
16.4
%