Supercuts 2005 Annual Report Download - page 35
Download and view the complete annual report
Please find page 35 of the 2005 Supercuts annual report below. You can navigate through the pages in the report by either clicking on the pages listed below, or by using the keyword search tool below to find specific information within the annual report.-
 1
1 -
2
-
3
-
4
-
5
-
6
-
7
-
8
-
9
-
10
-
11
-
12
-
13
-
14
-
15
-
16
-
17
-
18
-
19
-
20
-
21
-
22
-
23
-
24
-
 25
25 -
 26
26 -
 27
27 -
 28
28 -
 29
29 -
 30
30 -
 31
31 -
 32
32 -
 33
33 -
 34
34 -
 35
35 -
 36
36 -
 37
37 -
 38
38 -
 39
39 -
 40
40 -
 41
41 -
 42
42 -
 43
43 -
 44
44 -
 45
45 -
46
-
47
-
48
-
49
-
50
-
51
-
52
-
53
-
54
-
55
-
56
-
57
-
58
-
59
-
60
-
61
-
62
-
63
-
64
-
65
-
66
-
67
-
68
-
69
-
70
-
71
-
72
-
73
-
74
-
75
-
76
-
77
-
78
-
79
-
80
-
81
-
82
-
83
-
84
-
85
-
86
-
87
-
88
-
89
-
90
-
91
-
92
-
93
-
94
-
95
-
96
-
97
-
98
-
99
-
100
-
101
-
102
-
103
-
104
-
105
-
106
-
107
-
108
-
109
-
110
-
111
-
112
-
113
-
114
-
115
-
116
-
117
-
118
-
119
-
120
-
121
 |
 |

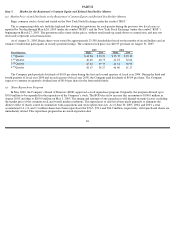
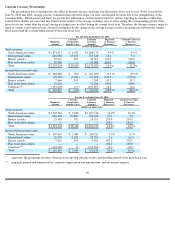
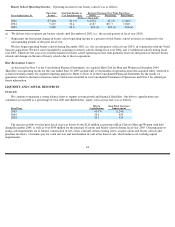
Salon same-store sales increases or decreases are calculated on a daily basis as the total change in sales for company-owned salons which
were open on that specific day of the week during the corresponding prior period. Annual salon same-store sales increases are the sum of the
same-store sales increases computed on a daily basis. Relocated salons are included in same-store sales as they are considered to have been
open in the prior period. International same-store sales are calculated in local currencies so that foreign currency fluctuations do not impact the
calculation. Management believes that same-store sales, a component of organic growth, are useful in order to help determine the increase in
revenue attributable to its organic growth (new salon construction and same-store sales growth) versus growth from acquisitions.
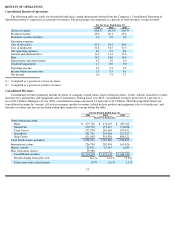
The 14.1 and 14.2 percent increases in consolidated revenues during fiscal year 2005 and 2004, respectively, were driven by the
following:
We acquired 444 and 405 company-owned salons during the years ended June 30, 2005 and 2004, respectively, including 139 franchise
buybacks during fiscal year 2005 and 206 during fiscal year 2004. Additionally, we acquired 13 and six beauty schools in fiscal year 2005 and
2004, respectively, and 42 company-owned hair restoration centers in fiscal year 2005. The organic growth stemmed from the construction of
525 and 452 company-owned salons during the twelve months ended June 30, 2005 and 2004, respectively, as well as consolidated same-store
sales increases. During fiscal year 2005 and 2004, the foreign currency impact was driven by the weakening of the United States dollar against
the British pound, Euro and Canadian dollar as compared to the prior periods’ exchange rates. The impact of foreign currency was calculated
by multiplying current year revenues in local currencies by the change in the foreign currency exchange rate between the current fiscal year and
the prior fiscal year.
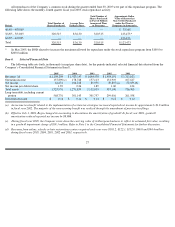
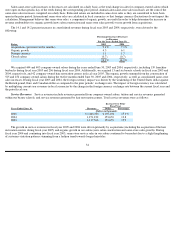
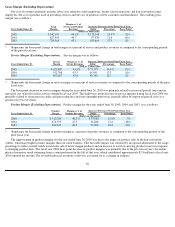
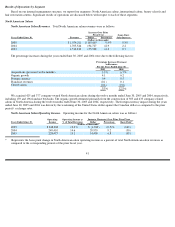
Service Revenues. Service revenues include revenues generated from company-owned salons, tuition and service revenues generated
within our beauty schools, and service revenues generated by hair restoration centers. Total service revenues were as follows:
The growth in service revenues in fiscal year 2005 and 2004 were driven primarily by acquisitions (including the acquisition of the hair
restoration centers during fiscal year 2005) and organic growth in our salons (new salon construction and same-store sales growth). During
fiscal year 2004 and continuing into fiscal year 2005, same-store service sales in our salons continued to be modest due to a slight lengthening
of customer visitation patterns stemming from a fashion trend towards longer hairstyles.
34
Percentage Increase (Decrease)
in Revenues
For the Years Ended June 30,
Factor
2005
2004
Acquisitions (previous twelve months)
9.4
%
7.1
%
Organic growth
4.3
6.1
Foreign currency
1.1
1.7
Closed salons
(0.7
)
(0.7
)
14.1
%
14.2
%
Increase Over Prior
Fiscal Year
Years Ended June 30,
Revenues
Dollar
Percentage
(Dollars in thousands)
2005
$
1,466,336
$
195,104
15.3
%
2004
1,271,232
153,670
13.8
2003
1,117,562
153,678
15.9