Supercuts 2005 Annual Report Download - page 95
Download and view the complete annual report
Please find page 95 of the 2005 Supercuts annual report below. You can navigate through the pages in the report by either clicking on the pages listed below, or by using the keyword search tool below to find specific information within the annual report.-
 1
1 -
2
-
3
-
4
-
5
-
6
-
7
-
8
-
9
-
10
-
11
-
12
-
13
-
14
-
15
-
16
-
17
-
18
-
19
-
20
-
21
-
22
-
23
-
24
-
25
-
26
-
27
-
28
-
29
-
30
-
31
-
32
-
33
-
34
-
35
-
36
-
37
-
38
-
39
-
40
-
41
-
42
-
43
-
44
-
45
-
46
-
47
-
48
-
49
-
50
-
51
-
52
-
53
-
54
-
55
-
56
-
57
-
58
-
59
-
60
-
61
-
62
-
63
-
64
-
65
-
66
-
67
-
68
-
69
-
70
-
71
-
72
-
73
-
74
-
75
-
76
-
77
-
78
-
79
-
80
-
81
-
82
-
83
-
84
-
 85
85 -
 86
86 -
 87
87 -
 88
88 -
 89
89 -
 90
90 -
 91
91 -
 92
92 -
 93
93 -
 94
94 -
 95
95 -
 96
96 -
 97
97 -
 98
98 -
 99
99 -
 100
100 -
 101
101 -
 102
102 -
 103
103 -
 104
104 -
 105
105 -
106
-
107
-
108
-
109
-
110
-
111
-
112
-
113
-
114
-
115
-
116
-
117
-
118
-
119
-
120
-
121
 |
 |

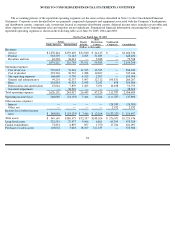
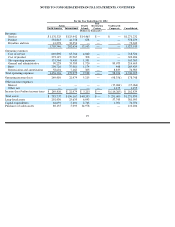
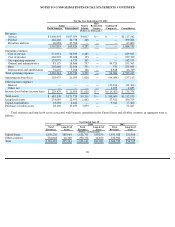
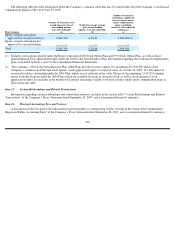
NOTES TO CONSOLIDATED FINANCIAL STATEMENTS, CONTINUED
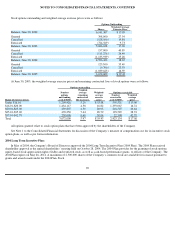
The accounting policies of the reportable operating segments are the same as those described in Note 1 to the Consolidated Financial
Statements. Corporate assets detailed below are primarily comprised of property and equipment associated with the Company’s headquarters
and distribution centers, corporate cash, inventories located at corporate distribution centers, deferred income taxes, franchise receivables and
other corporate assets. Intersegment sales and transfers are not significant. Summarized financial information concerning the Company’s
reportable operating segments is shown in the following table as of June 30, 2005, 2004 and 2003:
94
For the Year Ended June 30, 2005
Salons
Beauty
Hair
Restoration
Unallocated
North America
International
Schools
Centers
Corporate
Consolidated
(Dollars in thousands)
Revenues:
Service
$
1,270,444
$
139,629
$
31,848
$
24,415
$
—
$
1,466,336
Product
563,529
51,143
2,063
31,685
—
648,420
Royalties and fees
40,238
36,012
—
3,288
—
79,538
1,874,211
226,784
33,911
59,388
—
2,194,294
Operating expenses:
Cost of service
737,045
74,344
11,535
13,525
—
836,449
Cost of product
293,336
30,745
1,288
10,267
—
335,636
Site operating expenses
166,680
9,750
4,319
2,307
—
183,056
General and administrative
99,210
42,357
5,097
12,712
100,831
260,207
Rent
262,818
41,523
2,943
3,242
458
310,984
Depreciation and amortization
67,042
7,879
1,263
5,071
10,498
91,753
Goodwill impairment
—
38,319
—
—
—
38,319
Total operating expenses
1,626,131
244,917
26,445
47,124
111,787
2,056,404
Operating income (loss)
248,080
(18,133
)
7,466
12,264
(111,787
)
137,890
Other income (expense):
Interest
—
—
—
—
(
24,385
)
(24,385
)
Other, net
—
—
—
—
2,952
2,952
Income (loss) before income
taxes
$
248,080
$
(18,133
)
$
7,466
$
12,264
$
(133,220
)
$
116,457
Total assets
$
949,149
$
180,375
$
72,357
$
248,024
$
276,071
$
1,725,976
Long
-
lived assets
322,581
27,477
9,066
6,801
69,399
435,324
Capital expenditures
73,831
6,895
857
1,750
17,764
101,097
Purchases of salon assets
103,022
3,018
18,107
211,233
—
335,380