Supercuts 2005 Annual Report Download - page 42
Download and view the complete annual report
Please find page 42 of the 2005 Supercuts annual report below. You can navigate through the pages in the report by either clicking on the pages listed below, or by using the keyword search tool below to find specific information within the annual report.-
 1
1 -
2
-
3
-
4
-
5
-
6
-
7
-
8
-
9
-
10
-
11
-
12
-
13
-
14
-
15
-
16
-
17
-
18
-
19
-
20
-
21
-
22
-
23
-
24
-
25
-
26
-
27
-
28
-
29
-
30
-
31
-
 32
32 -
 33
33 -
 34
34 -
 35
35 -
 36
36 -
 37
37 -
 38
38 -
 39
39 -
 40
40 -
 41
41 -
 42
42 -
 43
43 -
 44
44 -
 45
45 -
 46
46 -
 47
47 -
 48
48 -
 49
49 -
 50
50 -
 51
51 -
 52
52 -
53
-
54
-
55
-
56
-
57
-
58
-
59
-
60
-
61
-
62
-
63
-
64
-
65
-
66
-
67
-
68
-
69
-
70
-
71
-
72
-
73
-
74
-
75
-
76
-
77
-
78
-
79
-
80
-
81
-
82
-
83
-
84
-
85
-
86
-
87
-
88
-
89
-
90
-
91
-
92
-
93
-
94
-
95
-
96
-
97
-
98
-
99
-
100
-
101
-
102
-
103
-
104
-
105
-
106
-
107
-
108
-
109
-
110
-
111
-
112
-
113
-
114
-
115
-
116
-
117
-
118
-
119
-
120
-
121
 |
 |

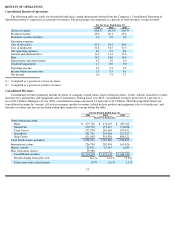
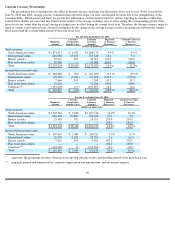
Results of Operations by Segment
Based on our internal management structure, we report four segments: North American salons, international salons, beauty schools and
hair restoration centers. Significant results of operations are discussed below with respect to each of these segments.
North American Salons
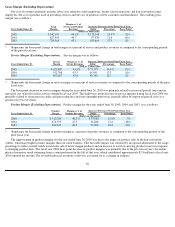
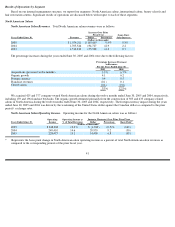
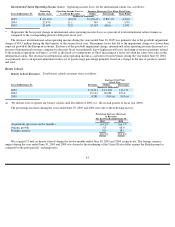
North American Salon Revenues. Total North American salon revenues were as follows:
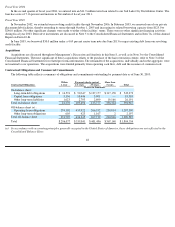
The percentage increases during the years ended June 30, 2005 and 2004 were due to the following factors:
We acquired 425 and 377 company-owned North American salons during the twelve months ended June 30, 2005 and 2004, respectively,
including 139 and 196 franchise buybacks. The organic growth stemmed primarily from the construction of 503 and 433 company-owned
salons in North America during the twelve months ended June 30, 2005 and 2004, respectively. The foreign currency impact during the years
ended June 30, 2005 and 2004 was driven by the weakening of the United States dollar against the Canadian dollar as compared to the prior
periods’ exchange rates.
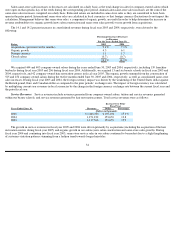
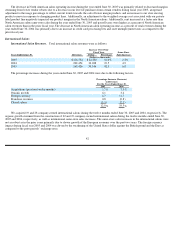
North American Salon Operating Income. Operating income for the North American salons was as follows:
*
Represents the basis point change in North American salon operating income as a percent of total North American salon revenues as
compared to the corresponding periods of the prior fiscal year.
41
Increase Over Prior
Fiscal Year
Same
-
Store
Years Ended June 30,
Revenues
Dollar
Percentage
Sales Increase
(Dollars in thousands)
2005
$
1,874,211
$
168,665
9.9
%
0.8
%
2004
1,705,546
194,727
12.9
2.2
2003
1,510,819
175,708
13.2
0.7
Percentage Increase (Decrease)
in Revenues
For the Years Ended June 30,
2005
2004
Acquisitions (previous twelve months)
5.9
%
6.7
%
Organic growth
4.1
6.2
Foreign currency
0.4
0.5
Franchise revenues
(0.1
)
0.1
Closed salons
(0.4
)
(0.6
)
9.9
%
12.9
%
Operating
Operating Income as
Increase (Decrease) Over Prior Fiscal Year
Years Ended June 30,
Income
% of Total Revenues
Dollar
Percentage
Basis Point*
(Dollars in thousands)
2005
$
248,080
13.2
%
$
(1,330
)
(0.5
)%
(140
)
2004
249,410
14.6
20,935
9.2
(50
)
2003
228,475
15.1
14,490
6.8
(90
)