Supercuts 2005 Annual Report Download - page 76
Download and view the complete annual report
Please find page 76 of the 2005 Supercuts annual report below. You can navigate through the pages in the report by either clicking on the pages listed below, or by using the keyword search tool below to find specific information within the annual report.-
 1
1 -
2
-
3
-
4
-
5
-
6
-
7
-
8
-
9
-
10
-
11
-
12
-
13
-
14
-
15
-
16
-
17
-
18
-
19
-
20
-
21
-
22
-
23
-
24
-
25
-
26
-
27
-
28
-
29
-
30
-
31
-
32
-
33
-
34
-
35
-
36
-
37
-
38
-
39
-
40
-
41
-
42
-
43
-
44
-
45
-
46
-
47
-
48
-
49
-
50
-
51
-
52
-
53
-
54
-
55
-
56
-
57
-
58
-
59
-
60
-
61
-
62
-
63
-
64
-
65
-
 66
66 -
 67
67 -
 68
68 -
 69
69 -
 70
70 -
 71
71 -
 72
72 -
 73
73 -
 74
74 -
 75
75 -
 76
76 -
 77
77 -
 78
78 -
 79
79 -
 80
80 -
 81
81 -
 82
82 -
 83
83 -
 84
84 -
 85
85 -
 86
86 -
87
-
88
-
89
-
90
-
91
-
92
-
93
-
94
-
95
-
96
-
97
-
98
-
99
-
100
-
101
-
102
-
103
-
104
-
105
-
106
-
107
-
108
-
109
-
110
-
111
-
112
-
113
-
114
-
115
-
116
-
117
-
118
-
119
-
120
-
121
 |
 |

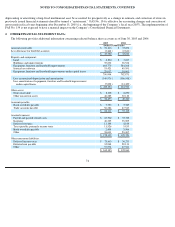
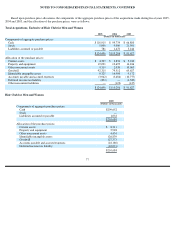
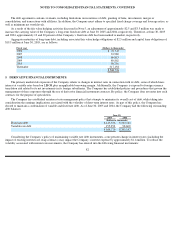
NOTES TO CONSOLIDATED FINANCIAL STATEMENTS, CONTINUED
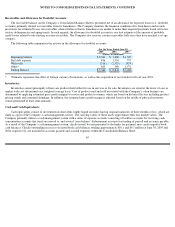
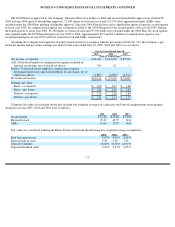
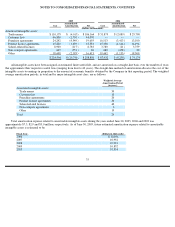
All intangible assets have been assigned an estimated finite useful life, and are amortized on a straight-line basis over the number of years
that approximate their respective useful lives (ranging from four to 40 years). The straight-line method of amortization allocates the cost of the
intangible assets to earnings in proportion to the amount of economic benefits obtained by the Company in that reporting period. The weighted
average amortization periods, in total and by major intangible asset class, are as follows:
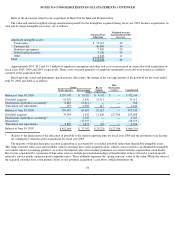
Total amortization expense related to amortizable intangible assets during the years ended June 30, 2005, 2004 and 2003 was
approximately $7.5, $2.9 and $3.0 million, respectively. As of June 30, 2005, future estimated amortization expense related to amortizable
intangible assets is estimated to be:
75
2005
2004
Accumulated
Accumulated
Cost
Amortization
Net
Cost
Amortization
Net
(Dollars in thousands)
Amortized intangible assets:
Trade names
$
110,179
$
(4,015
)
$
106,164
$
31,879
$
(2,089
)
$
29,790
Customer lists
46,800
(2,730
)
44,070
—
—
—
Franchise agreements
24,242
(4,549
)
19,693
16,513
(3,413
)
13,100
Product license agreements
15,220
(1,639
)
13,581
15,338
(1,144
)
14,194
School
-
related licenses
8,900
(117
)
8,783
3,780
(21
)
3,759
Non
-
compete agreements
647
(551
)
96
480
(458
)
22
Other
18,608
(2,195
)
16,413
19,442
(1,133
)
18,309
$
224,596
$
(15,796
)
$
208,800
$
87,432
$
(8,258
)
$
79,174
Weighted Average
Amortization Period
(in years)
Amortized intangible assets:
Trade names
39
Customer list
10
Franchise agreements
20
Product license agreements
30
School
-
related licenses
40
Non
-
compete agreements
6
Other
19
Total
29
Fiscal Year
(Dollars in thousands)
2006
$
10,956
2007
10,952
2008
10,921
2009
10,852
2010
10,814