Supercuts 2005 Annual Report Download - page 39
Download and view the complete annual report
Please find page 39 of the 2005 Supercuts annual report below. You can navigate through the pages in the report by either clicking on the pages listed below, or by using the keyword search tool below to find specific information within the annual report.-
 1
1 -
2
-
3
-
4
-
5
-
6
-
7
-
8
-
9
-
10
-
11
-
12
-
13
-
14
-
15
-
16
-
17
-
18
-
19
-
20
-
21
-
22
-
23
-
24
-
25
-
26
-
27
-
28
-
 29
29 -
 30
30 -
 31
31 -
 32
32 -
 33
33 -
 34
34 -
 35
35 -
 36
36 -
 37
37 -
 38
38 -
 39
39 -
 40
40 -
 41
41 -
 42
42 -
 43
43 -
 44
44 -
 45
45 -
 46
46 -
 47
47 -
 48
48 -
 49
49 -
50
-
51
-
52
-
53
-
54
-
55
-
56
-
57
-
58
-
59
-
60
-
61
-
62
-
63
-
64
-
65
-
66
-
67
-
68
-
69
-
70
-
71
-
72
-
73
-
74
-
75
-
76
-
77
-
78
-
79
-
80
-
81
-
82
-
83
-
84
-
85
-
86
-
87
-
88
-
89
-
90
-
91
-
92
-
93
-
94
-
95
-
96
-
97
-
98
-
99
-
100
-
101
-
102
-
103
-
104
-
105
-
106
-
107
-
108
-
109
-
110
-
111
-
112
-
113
-
114
-
115
-
116
-
117
-
118
-
119
-
120
-
121
 |
 |

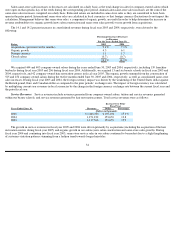
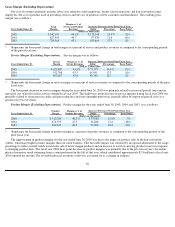
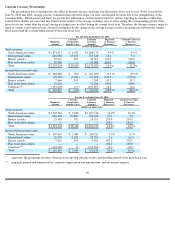
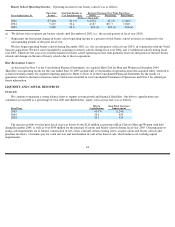
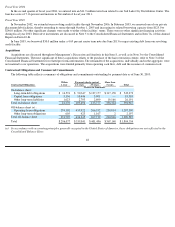
Rent
Rent expense, which includes base and percentage rent, common area maintenance and real estate taxes, was as follows:
* Represents the basis point change in rent expense as a percent of total revenues as compared to the corresponding periods of the prior
fiscal year.
The increase in this fixed-cost expense as a percent of total revenues was primarily due to rent increasing at a faster rate than salon same-
store sales during the year ended June 30, 2005. During fiscal year 2004, rent expense remained consistent as a percent of consolidated
revenues compared to the prior fiscal year.
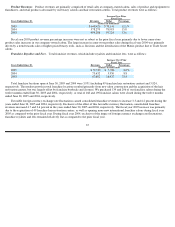
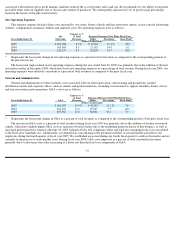
Depreciation and Amortization
Depreciation and amortization expense (D&A) was as follows:
* Represents the basis point change in depreciation and amortization as a percent of total revenues as compared to the corresponding
periods of the prior fiscal year.
The basis point increase in this expense category as a percent of total revenues was primarily due to amortization of intangible assets that
we acquired in the acquisition of the hair restoration centers during the second quarter of fiscal year 2005. During fiscal year 2004, D&A
remained relatively consistent as a percent of total consolidated revenues compared to the prior fiscal year.
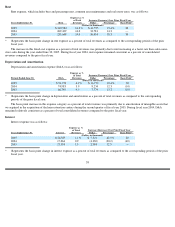
Interest
Interest expense was as follows:
* Represents the basis point change in interest expense as a percent of total revenues as compared to the corresponding periods of the prior
fiscal year.
38
Expense as %
of Total
Increase (Decrease) Over Prior Fiscal Year
Years Ended June 30,
Rent
Revenues
Dollar
Percentage
Basis Point*
(Dollars in thousands)
2005
$
310,984
14.2
%
$
41,555
15.4
%
20
2004
269,429
14.0
33,781
14.3
—
2003
235,648
14.0
36,434
18.3
30
Expense as %
of Total
Increase (Decrease) Over Prior Fiscal Year
Periods Ended June 30,
D&A
Revenues
Dollar
Percentage
Basis Point*
(Dollars in thousands)
2005
$
91,753
4.2
%
$
16,770
22.4
%
30
2004
74,983
3.9
8,234
12.3
(10
)
2003
66,749
4.0
7,774
13.2
(10
)
Expense as %
of Total
Increase (Decrease) Over Prior Fiscal Year
Years Ended June 30,
Interest
Revenues
Dollar
Percentage
Basis Point*
(Dollars in thousands)
2005
$
24,385
1.1
%
$
7,321
42.9
%
20
2004
17,064
0.9
(4,330
)
(20.2
)
(40
)
2003
21,394
1.3
2,384
12.5
—