Sharp 2014 Annual Report Download - page 65
Download and view the complete annual report
Please find page 65 of the 2014 Sharp annual report below. You can navigate through the pages in the report by either clicking on the pages listed below, or by using the keyword search tool below to find specific information within the annual report.-
 1
1 -
2
-
3
-
4
-
5
-
6
-
7
-
8
-
9
-
10
-
11
-
12
-
13
-
14
-
15
-
16
-
17
-
18
-
19
-
20
-
21
-
22
-
23
-
24
-
25
-
26
-
27
-
28
-
29
-
30
-
31
-
32
-
33
-
34
-
35
-
36
-
37
-
38
-
39
-
40
-
41
-
42
-
43
-
44
-
45
-
46
-
47
-
48
-
49
-
50
-
51
-
52
-
53
-
54
-
 55
55 -
 56
56 -
 57
57 -
 58
58 -
 59
59 -
 60
60 -
 61
61 -
 62
62 -
 63
63 -
 64
64 -
 65
65 -
 66
66 -
 67
67 -
 68
68 -
 69
69 -
 70
70 -
 71
71 -
 72
72 -
 73
73 -
 74
74 -
 75
75
 |
 |

Annual Report 2014 63
Financial Section
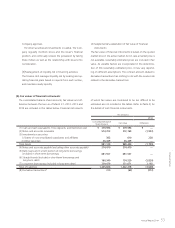
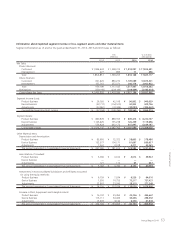
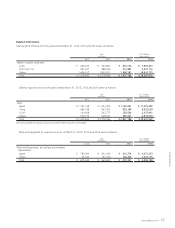
Information about reported segment income or loss, segment assets and other material items
Segment information as of and for the years ended March 31, 2012, 2013 and 2014 was as follows:
Yen
(millions)
U.S. Dollars
(thousands)
2012 2013 2014 2014
Net Sales:
Product Business:
Customers ¥ 1,854,424 ¥ 1,598,312 ¥ 1,818,097 $ 17,824,481
Intersegment 427 893 71 696
Total 1,854,851 1,599,205 1,818,168 17,825,177
Device Business:
Customers 601,426 880,274 1,109,089 10,873,421
Intersegment 357,763 237,271 208,378 2,042,922
Total 959,189 1,117,545 1,317,467 12,916,343
Eliminations (358,190) (238,164) (208,449) (2,043,618)
Consolidated Net Sales ¥ 2,455,850 ¥ 2,478,586 ¥ 2,927,186 $ 28,697,902
Segment Income (Loss):
Product Business ¥ 29,026 ¥ 42,198 ¥ 96,802 $ 949,039
Device Business (32,717) (154,510) 44,853 439,736
Adjustments (33,861) (33,954) (33,095) (324,461)
Consolidated operating (loss) income ¥ (37,552) ¥ (146,266) ¥ 108,560 $ 1,064,314
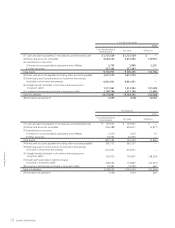
Segment Assets:
Product Business ¥ 890,878 ¥ 889,353 ¥ 839,474 $ 8,230,137
Device Business 1,166,429 735,238 726,209 7,119,696
Adjustments 556,828 463,172 615,997 6,039,187
Consolidated Assets ¥ 2,614,135 ¥ 2,087,763 ¥ 2,181,680 $ 21,389,020
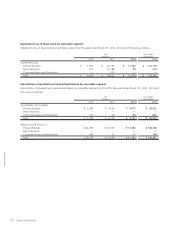
Other Material Items
Depreciation and Amortization:
Product Business ¥ 85,950 ¥ 72,323 ¥ 38,605 $ 378,480
Device Business 153,577 104,171 81,667 800,657
Adjustments 7,563 4,518 4,311 42,265
The amount presented in Consolidated Financial Statements ¥ 247,090 ¥ 181,012 ¥ 124,583 $ 1,221,402
Amortization of Goodwill:
Product Business ¥ 5,066 ¥ 4,614 ¥ 4,072 $ 39,922
Device Business — — — —
Adjustments 121 116 65 637
The amount presented in Consolidated Financial Statements ¥ 5,187 ¥ 4,730 ¥ 4,137 $ 40,559
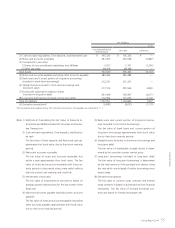
Investments in Nonconsolidated Subsidiaries and Affiliates accounted
for using the equity methods:
Product Business ¥ 9,759 ¥ 7,034 ¥ 6,529 $ 64,010
Device Business 1,550 70,755 75,217 737,421
Adjustments 22,807 25,245 28,310 277,549
The amount presented in Consolidated Financial Statements ¥ 34,116 ¥ 103,034 ¥ 110,056 $ 1,078,980
Increase in Plant, Equipment and Intangible Assets:
Product Business ¥ 76,102 ¥ 55,454 ¥ 45,356 $ 444,667
Device Business 115,111 66,409 30,436 298,392
Adjustments 13,493 8,142 6,308 61,843
The amount presented in Consolidated Financial Statements ¥ 204,706 ¥ 130,005 ¥ 82,100 $ 804,902