Sharp 2014 Annual Report Download - page 35
Download and view the complete annual report
Please find page 35 of the 2014 Sharp annual report below. You can navigate through the pages in the report by either clicking on the pages listed below, or by using the keyword search tool below to find specific information within the annual report.-
 1
1 -
2
-
3
-
4
-
5
-
6
-
7
-
8
-
9
-
10
-
11
-
12
-
13
-
14
-
15
-
16
-
17
-
18
-
19
-
20
-
21
-
22
-
23
-
24
-
 25
25 -
 26
26 -
 27
27 -
 28
28 -
 29
29 -
 30
30 -
 31
31 -
 32
32 -
 33
33 -
 34
34 -
 35
35 -
 36
36 -
 37
37 -
 38
38 -
 39
39 -
 40
40 -
 41
41 -
 42
42 -
 43
43 -
 44
44 -
 45
45 -
46
-
47
-
48
-
49
-
50
-
51
-
52
-
53
-
54
-
55
-
56
-
57
-
58
-
59
-
60
-
61
-
62
-
63
-
64
-
65
-
66
-
67
-
68
-
69
-
70
-
71
-
72
-
73
-
74
-
75
 |
 |

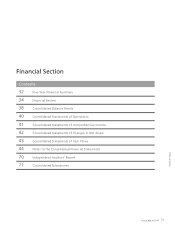
Annual Report 2014 33
Financial Section
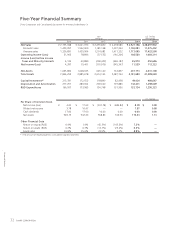
Yen
(millions)
U.S. Dollars
(thousands)
2010 2011 2012 2013 2014 2014
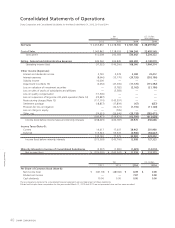
Net Sales ¥ 2,755,948 ¥ 3,021,973 ¥ 2,455,850 ¥ 2,478,586 ¥ 2,927,186 $ 28,697,902
Sales by Product Group*2
(Sales to Outside Customers)
Audio-Visual and
Communication Equipment 1,332,129 1,426,243 1,060,770 732,017 — —
Health and Environmental
Equipment 244,090 269,845 292,224 309,613 — —
Information Equipment 266,920 273,900 277,561 296,787 — —
Consumer/Information Products 1,843,139 1,969,988 1,630,555 1,338,417 — —
LCDs 508,630 614,373 420,226 650,847 — —
Solar Cells 208,732 265,492 223,869 259,895 — —
Other Electronic Devices 195,447 172,120 181,200 229,427 — —
Electronic Components 912,809 1,051,985 825,295 1,140,169 — —
Total 2,755,948 3,021,973 2,455,850 2,478,586 — —
Digital Information Equipment — — — 732,017 733,317 7,189,383
Health and Environmental
Equipment — — — 309,613 326,896 3,204,863
Solar Cells — — — 259,895 439,028 4,304,196
Business Solutions — — — 296,787 318,856 3,126,039
Product Business — — — 1,598,312 1,818,097 17,824,481
LCDs — — — 650,847 814,718 7,987,431
Electronic Devices — — — 229,427 294,371 2,885,990
Device Business — — — 880,274 1,109,089 10,873,421
Total — — — 2,478,586 2,927,186 28,697,902
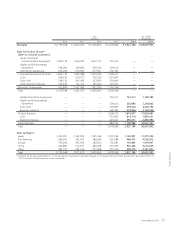
Sales by Region
Japan 1,429,057 1,592,909 1,181,168 1,007,264 1,150,091 11,275,402
The Americas 283,641 302,021 288,380 355,288 468,473 4,592,873
Europe 336,642 367,962 282,606 174,381 144,804 1,419,647
China 422,881 516,977 483,298 667,933 925,348 9,072,039
Other 283,727 242,104 220,398 273,720 238,470 2,337,941
Total 2,755,948 3,021,973 2,455,850 2,478,586 2,927,186 28,697,902
*2 Effective for the year ended March 31, 2014, the segment classification has been changed. In this regard, Sales by Product Group for the year ended March 31,
2013, has been restated based on a new classification.