Sharp 2014 Annual Report Download - page 19
Download and view the complete annual report
Please find page 19 of the 2014 Sharp annual report below. You can navigate through the pages in the report by either clicking on the pages listed below, or by using the keyword search tool below to find specific information within the annual report.-
 1
1 -
2
-
3
-
4
-
5
-
6
-
7
-
8
-
 9
9 -
 10
10 -
 11
11 -
 12
12 -
 13
13 -
 14
14 -
 15
15 -
 16
16 -
 17
17 -
 18
18 -
 19
19 -
 20
20 -
 21
21 -
 22
22 -
 23
23 -
 24
24 -
 25
25 -
 26
26 -
 27
27 -
 28
28 -
 29
29 -
30
-
31
-
32
-
33
-
34
-
35
-
36
-
37
-
38
-
39
-
40
-
41
-
42
-
43
-
44
-
45
-
46
-
47
-
48
-
49
-
50
-
51
-
52
-
53
-
54
-
55
-
56
-
57
-
58
-
59
-
60
-
61
-
62
-
63
-
64
-
65
-
66
-
67
-
68
-
69
-
70
-
71
-
72
-
73
-
74
-
75
 |
 |
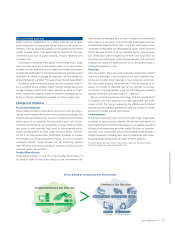
Main Products
LCD color televisions, color televisions, projectors, Blu-ray Disc recorders, mobile phones, tablet terminals, electronic dictionaries,
calculators, facsimiles, telephones
Main Products
Refrigerators, superheated steam ovens, microwave ovens, small cooking appliances, air conditioners, washing machines, vacuum
cleaners, air purifiers, electric fans, dehumidifiers, humidifiers, Plasmacluster Ion generators, electric heaters, beauty appliances, LED
lights, network control units
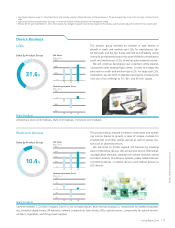
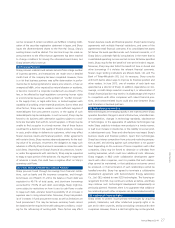
Digital Information Equipment
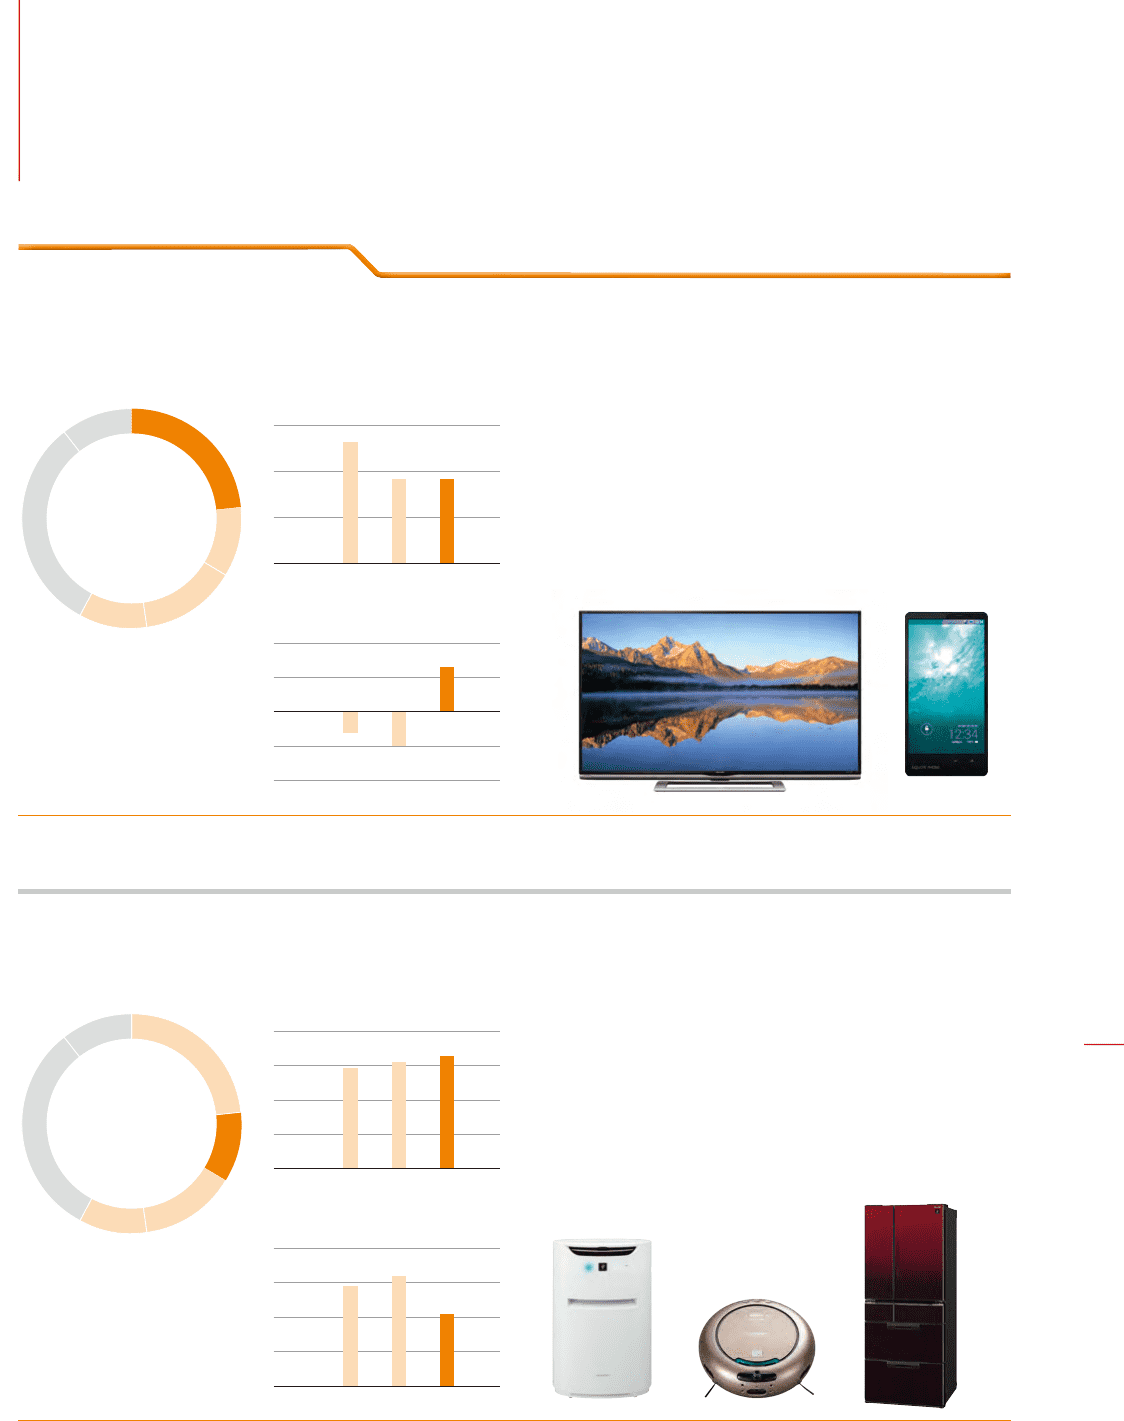
Health and Environmental Equipment
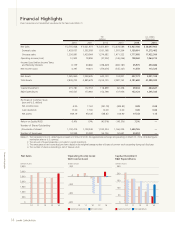
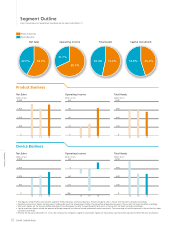
• Sales gures include internal sales between segments (Product Business and Device Business). The percentage of sales in the pie chart has been calculated accordingly.
• Operating income (loss) gures are the amounts before adjustments for intersegment trading. The percentage of operating income in the pie chart has been calculated accordingly.
• Total assets gures are the amounts before adjustments for intersegment trading. The percentage of total assets in the pie chart has been calculated accordingly.
• Capital investment gures include the amounts of leased properties, and do not include unallocated capital investments. The percentage of capital investment in the pie chart has been
• Effective for the year ended March 31, 2014, the Company has changed its segment classication. Figures for the previous years have been adjusted to reect the new classication.
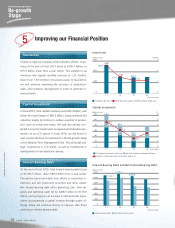
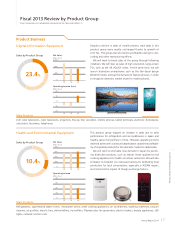
Product Business
Despite a decline in sales of mobile phones, total sales in this
product group were mostly unchanged thanks to growth of
LCD TVs. This group also returned to profitability owing to cost-
cutting and other restructuring efforts.
We will work to boost sales of the group through following
initiatives. We will step up sales of high-resolution, large-screen
TVs, such as the 4K AQUOS series. At the same time, we will
launch distinctive smartphones such as the thin-bezel design
EDGEST model, and tap the demand of feature phones, in order
to recapture domestic market share for mobile phones.
Sales by Product Group
23.4%
Net Sales
(billions of yen)
1,200
800
400
0
141312
Operating Income (Loss)
(billions of yen)
20
10
0
-20
-10
141312
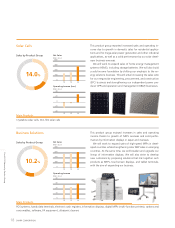
This product group enjoyed an increase in sales due to solid
performance for refrigerators and air-conditioners in Japan and
healthy sales of air purifiers in China. However, operating income
declined as the yen’s continued depreciation caused the profitabil-
ity of imported products for the domestic market to deteriorate.
We will work to stimulate new demand in Japan by launch-
ing distinctive products, such as robotic home appliances and
cooking appliances for health-conscious customers. We will also
endeavor to broaden our overseas business by facilitating local
production for local consumption, especially in ASEAN region,
and minimize the impact of foreign exchange factors.
Sales by Product Group
10.4%
400
300
200
100
0
141312
Net Sales
(billions of yen)
40
30
20
0
10
141312
Operating Income
(billions of yen)
Fiscal 2013 Review by Product Group
Sharp Corporation and Consolidated Subsidiaries for the Years ended March 31
Annual Report 2014 17
Fiscal 2013 Review by Product Group