Sharp 2014 Annual Report Download - page 11
Download and view the complete annual report
Please find page 11 of the 2014 Sharp annual report below. You can navigate through the pages in the report by either clicking on the pages listed below, or by using the keyword search tool below to find specific information within the annual report.-
 1
1 -
 2
2 -
 3
3 -
 4
4 -
 5
5 -
 6
6 -
 7
7 -
 8
8 -
 9
9 -
 10
10 -
 11
11 -
 12
12 -
 13
13 -
 14
14 -
 15
15 -
 16
16 -
 17
17 -
 18
18 -
 19
19 -
 20
20 -
 21
21 -
 22
22 -
23
-
24
-
25
-
26
-
27
-
28
-
29
-
30
-
31
-
32
-
33
-
34
-
35
-
36
-
37
-
38
-
39
-
40
-
41
-
42
-
43
-
44
-
45
-
46
-
47
-
48
-
49
-
50
-
51
-
52
-
53
-
54
-
55
-
56
-
57
-
58
-
59
-
60
-
61
-
62
-
63
-
64
-
65
-
66
-
67
-
68
-
69
-
70
-
71
-
72
-
73
-
74
-
75
 |
 |

In Asia, Sharp particularly put its efforts to expand busi-
nesses. We fast-tracked the opening of a new plant in In-
donesia, and expanded and reinforced its sales networks in
newly emerging countries, such as Myanmar and Sri Lanka.
We also made concentrated efforts to expand business, in-
cluding through sales promotion campaigns using Japanese
animation characters.
We will continue concentrating business resources in Asia
while building solid business foundations and expanding our
business in the Middle East and Africa, especially the Sub-
Saharan region. In China, we will take advantage of strong
demand for air purifiers to continue adjusting our sales chan-
nel mix and product mix and thus increase profitability.
By streamlining headquarters, lowering personnel ex-
penses, reforming domestic and overseas operations, and
working on other efforts, Sharp, in fiscal 2013, achieved a
¥167 billion fixed cost reduction from fiscal 2011.
In fiscal 2014, we will continue pursuing company-wide
cost restructuring in order to reduce overall expenses.
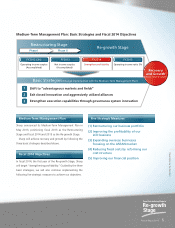
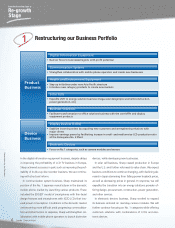
Expanding Overseas Businesses Focusing on the
ASEAN Market
3
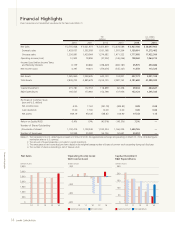
Reducing Fixed Costs by Reforming our Cost Structure
4
Asia
Middle East &
Africa
China
Europe &
the U.S.
Position as the top-priority region and allocate resources accordingly
The high-priority market after Asia; build solid business foundation and expand business,
especially in Sub-Saharan region
Improve profitability by changing sales channel mix and product mix
Step up initiatives with high-earnings business model in IT services business and
solutions business
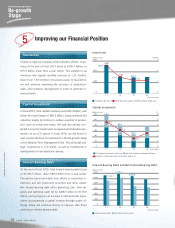
Fixed Costs
Fixed costs (left axis) Ratio to net sales (right axis)
37.3
915.8
836.1
748.7
33.7
25.6
800
600
(billions of yen)
1,000
30
20
(%)
40
14131211 (fiscal years)
Annual Report 2014 9
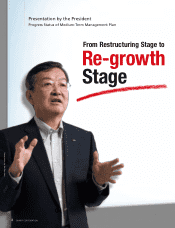
Presentation by the President
From Restructuring Stage to
Re-growth
Stage