Sharp 2014 Annual Report Download - page 18
Download and view the complete annual report
Please find page 18 of the 2014 Sharp annual report below. You can navigate through the pages in the report by either clicking on the pages listed below, or by using the keyword search tool below to find specific information within the annual report.-
 1
1 -
2
-
3
-
4
-
5
-
6
-
7
-
 8
8 -
 9
9 -
 10
10 -
 11
11 -
 12
12 -
 13
13 -
 14
14 -
 15
15 -
 16
16 -
 17
17 -
 18
18 -
 19
19 -
 20
20 -
 21
21 -
 22
22 -
 23
23 -
 24
24 -
 25
25 -
 26
26 -
 27
27 -
 28
28 -
29
-
30
-
31
-
32
-
33
-
34
-
35
-
36
-
37
-
38
-
39
-
40
-
41
-
42
-
43
-
44
-
45
-
46
-
47
-
48
-
49
-
50
-
51
-
52
-
53
-
54
-
55
-
56
-
57
-
58
-
59
-
60
-
61
-
62
-
63
-
64
-
65
-
66
-
67
-
68
-
69
-
70
-
71
-
72
-
73
-
74
-
75
 |
 |
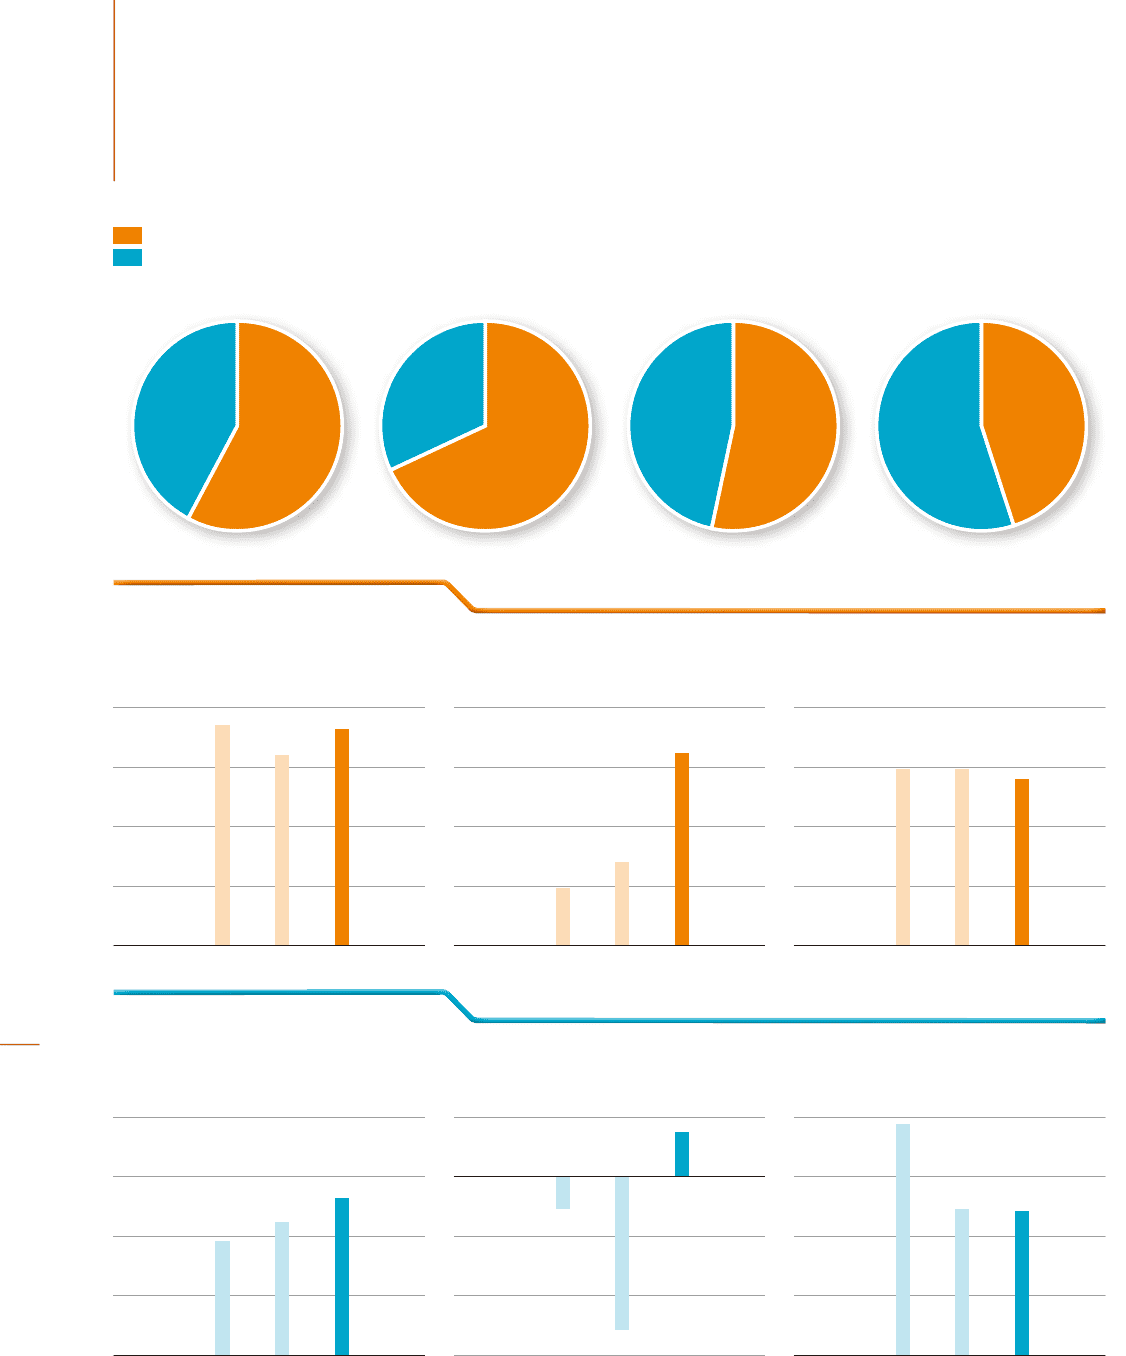
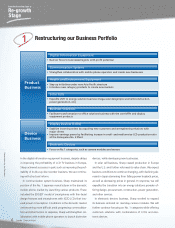
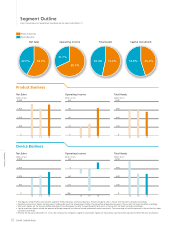
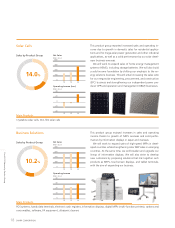
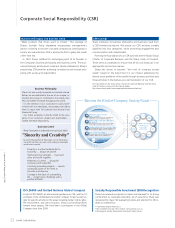
Products Business
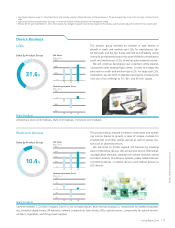
Device Business
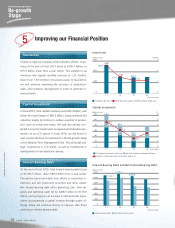
Net Sales Operating Income Total Assets Capital Investment
58.0%42.0% 53.6%46.4% 45.2%54.8%
68.3%
31.7%
Device Business
Net Sales
(billions of yen)
2,000
1,500
1,000
500
0
141312
Operating Income
(billions of yen)
60
0
-60
-120
-180
141312
Total Assets
(billions of yen)
1,200
900
600
300
0
141312
Net Sales
(billions of yen)
2,000
1,500
1,000
500
0
Operating Income
(billions of yen)
120
90
60
30
0
141312
Total Assets
(billions of yen)
1,200
900
600
300
0
141312141312
Product Business
• Sales gures include internal sales between segments (Product Business and Device Business). The percentage of sales in the pie chart has been calculated accordingly.
• Operating income (loss) gures are the amounts before adjustments for intersegment trading. The percentage of operating income in the pie chart has been calculated accordingly.
• Total assets gures are the amounts before adjustments for intersegment trading. The percentage of total assets in the pie chart has been calculated accordingly.
• Capital investment gures include the amounts of leased properties, and do not include unallocated capital investments. The percentage of capital investment in the pie chart has been
calculated accordingly.
• Effective for the year ended March 31, 2014, the Company has changed its segment classication. Figures for the previous years have been adjusted to reect the new classication.
Segment Outline
Sharp Corporation and Consolidated Subsidiaries for the Years Ended March 31
16 SHARP CORPORATION
Segment Outline