Sharp 2014 Annual Report Download - page 38
Download and view the complete annual report
Please find page 38 of the 2014 Sharp annual report below. You can navigate through the pages in the report by either clicking on the pages listed below, or by using the keyword search tool below to find specific information within the annual report.-
 1
1 -
2
-
3
-
4
-
5
-
6
-
7
-
8
-
9
-
10
-
11
-
12
-
13
-
14
-
15
-
16
-
17
-
18
-
19
-
20
-
21
-
22
-
23
-
24
-
25
-
26
-
27
-
 28
28 -
 29
29 -
 30
30 -
 31
31 -
 32
32 -
 33
33 -
 34
34 -
 35
35 -
 36
36 -
 37
37 -
 38
38 -
 39
39 -
 40
40 -
 41
41 -
 42
42 -
 43
43 -
 44
44 -
 45
45 -
 46
46 -
 47
47 -
 48
48 -
49
-
50
-
51
-
52
-
53
-
54
-
55
-
56
-
57
-
58
-
59
-
60
-
61
-
62
-
63
-
64
-
65
-
66
-
67
-
68
-
69
-
70
-
71
-
72
-
73
-
74
-
75
 |
 |
36 SHARP CORPORATION
Financial Section
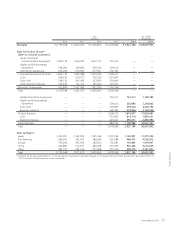
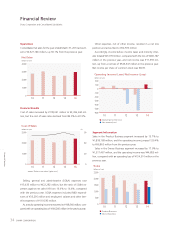
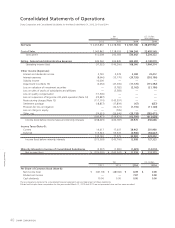
Electronic Devices
Sales in this group increased by 20.6% from the previous year
to ¥326,393 million, thanks mainly to increased sales of various
sensors such as camera modules and proximity sensors for smart-
phones. Operating income amounted to ¥3,265 million, compared
with an operating loss of ¥15,519 million in the previous year.
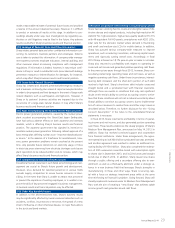
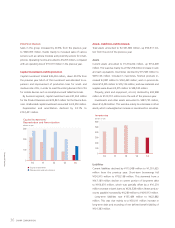
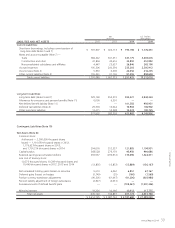
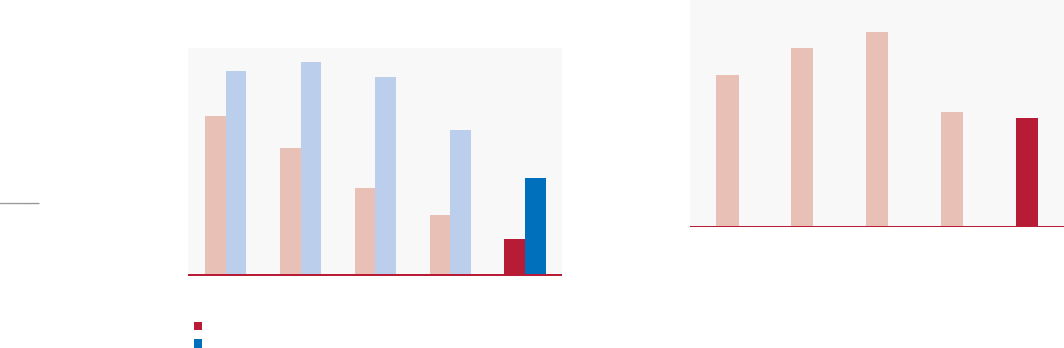
Capital Investment and Depreciation
Capital investment totaled ¥49,434 million, down 40.0% from
the previous year. Much of this investment was allocated to ex-
pansion and improvement of production lines for small- and
medium-size LCDs, in order to meet flourishing demand for LCDs
for mobile devices such as smartphones and tablet terminals.
By business segment, capital investment was ¥21,262 million
for the Product Business and ¥25,822 million for the Device Busi-
ness. Unallocated capital investment amounted to ¥2,350 million.
Depreciation and amortization declined by 33.1% to
¥132,401 million.
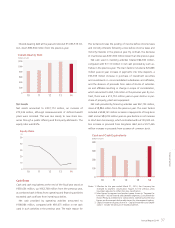
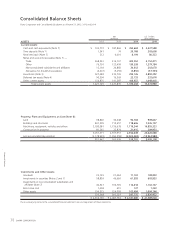
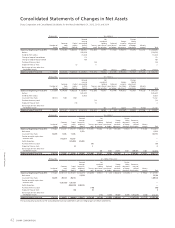
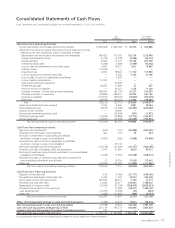
Assets, Liabilities and Net Assets
Total assets amounted to ¥2,181,680 million, up ¥93,917 mil-
lion from the end of the previous year.
Assets
Current assets amounted to ¥1,374,244 million, up ¥152,409
million. This was due mainly to a ¥162,768 million increase in cash
and cash equivalents. Inventories declined by ¥15,583 million to
¥295,126 million. Included in inventories, finished products in-
creased ¥3,087 million to ¥160,460 million; work in process de-
clined ¥14,295 million to ¥76,136 million; and raw materials and
supplies were down ¥4,375 million to ¥58,530 million.
Property, plant and equipment, at cost, declined by ¥43,998
million to ¥519,701 million since the end of the previous year.
Investments and other assets amounted to ¥287,735 million,
down ¥14,494 million. This was due mainly to a decrease in other
assets, which outweighed an increase in investments in securities.
Liabilities
Current liabilities declined by ¥115,908 million to ¥1,551,625
million from the previous year. Short-term borrowings fell
¥130,915 million to ¥793,198 million. This stemmed from a
¥147,189 million decline in current portion of long-term debt
to ¥166,670 million, which was partially offset by a ¥16,274
million increase in bank loans to ¥626,528 million. Notes and ac-
counts payable increased by ¥4,289 million to ¥409,913 million.
Long-term liabilities rose ¥137,489 million to ¥422,882
million. This was due mainly to a ¥50,011 million increase in
long-term debt and recording of net defined benefit liability of
¥101,383 million.
0
100
200
300
10 11 12 13 14
Capital investment
Depreciation and amortization
Capital Investment/
Depreciation and Amortization
(billions of yen)
0
100
200
300
400
500
600
10 11 12 13 14
Inventories
(billions of yen)