Sharp 2014 Annual Report Download - page 43
Download and view the complete annual report
Please find page 43 of the 2014 Sharp annual report below. You can navigate through the pages in the report by either clicking on the pages listed below, or by using the keyword search tool below to find specific information within the annual report.-
 1
1 -
2
-
3
-
4
-
5
-
6
-
7
-
8
-
9
-
10
-
11
-
12
-
13
-
14
-
15
-
16
-
17
-
18
-
19
-
20
-
21
-
22
-
23
-
24
-
25
-
26
-
27
-
28
-
29
-
30
-
31
-
32
-
 33
33 -
 34
34 -
 35
35 -
 36
36 -
 37
37 -
 38
38 -
 39
39 -
 40
40 -
 41
41 -
 42
42 -
 43
43 -
 44
44 -
 45
45 -
 46
46 -
 47
47 -
 48
48 -
 49
49 -
 50
50 -
 51
51 -
 52
52 -
 53
53 -
54
-
55
-
56
-
57
-
58
-
59
-
60
-
61
-
62
-
63
-
64
-
65
-
66
-
67
-
68
-
69
-
70
-
71
-
72
-
73
-
74
-
75
 |
 |

Annual Report 2014 41
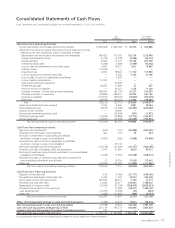
Financial Section
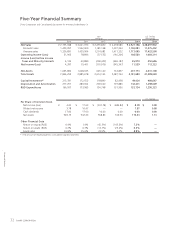
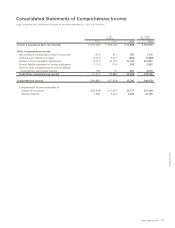
Consolidated Statements of Comprehensive Income
Sharp Corporation and Consolidated Subsidiaries for the Years Ended March 31, 2012, 2013 and 2014
Yen
(millions)
U.S. Dollars
(thousands)
2012 2013 2014 2014
Income (Loss) before Minority Interests ¥ (373,569) ¥ (543,766) ¥ 12,988 $ 127,333
Other Comprehensive Income:
Net unrealized holding gains (losses) on securities (515) 451 787 7,716
Deferred gains (losses) on hedges (4,725) 5,915 (364) (3,569)
Foreign currency translation adjustments (5,137) 30,150 21,178 207,627
Pension liability adjustment of foreign subsidiaries (1,112) (703) 298 2,922
Share of other comprehensive income of affiliates
accounted for using equity method 178 75 409 4,010
Total Other Comprehensive Income (11,311) 35,888 22,308 218,706
Comprehensive Income (384,880) (507,878) 35,296 346,039
Comprehensive income attributable to:
Owners of the parent (387,418) (511,037) 32,772 321,294
Minority interests 2,538 3,159 2,524 24,745