Sharp 2014 Annual Report Download - page 21
Download and view the complete annual report
Please find page 21 of the 2014 Sharp annual report below. You can navigate through the pages in the report by either clicking on the pages listed below, or by using the keyword search tool below to find specific information within the annual report.-
 1
1 -
2
-
3
-
4
-
5
-
6
-
7
-
8
-
9
-
10
-
 11
11 -
 12
12 -
 13
13 -
 14
14 -
 15
15 -
 16
16 -
 17
17 -
 18
18 -
 19
19 -
 20
20 -
 21
21 -
 22
22 -
 23
23 -
 24
24 -
 25
25 -
 26
26 -
 27
27 -
 28
28 -
 29
29 -
 30
30 -
 31
31 -
32
-
33
-
34
-
35
-
36
-
37
-
38
-
39
-
40
-
41
-
42
-
43
-
44
-
45
-
46
-
47
-
48
-
49
-
50
-
51
-
52
-
53
-
54
-
55
-
56
-
57
-
58
-
59
-
60
-
61
-
62
-
63
-
64
-
65
-
66
-
67
-
68
-
69
-
70
-
71
-
72
-
73
-
74
-
75
 |
 |

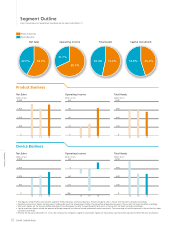
• Sales figures shown on pages 17-19 include internal sales between segments (Product Business and Device Business). The percentage of sales in pie charts has been calculated accord-
ingly.
• Operating income (loss) figures shown on pages 17-19 are the amounts before adjustments for intersegment trading.
• Effective for the year ended March 31, 2014, the Company has changed its segment classication. Figures for the previous years have been adjusted to reect the new classication.
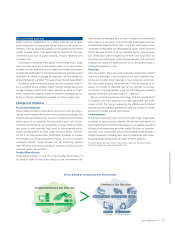
Main Products
Amorphous silicon LCD modules, IGZO LCD modules, CG-Silicon LCD modules
Main Products
Camera modules, CCD/CMOS imagers, LSIs for LCDs, microprocessors, ash memory, analog ICs, components for satellite broadcast-
ing, terrestrial digital tuners, RF modules, network components, laser diodes, LEDs, optical sensors, components for optical commu-
nications, regulators, switching power supplies
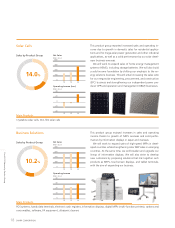
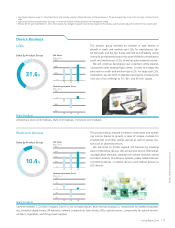
LCDs
Electronic Devices
Device Business
This product group reported an increase in sales thanks to
growth in small- and medium-size LCDs for smartphones, tab-
let terminals, and the like. It also returned to profitability, owing
mainly to an improved product mix as we shifted our emphasis to
small- and medium-size LCDs, as well as patent-related income.
We will continue developing new customers while expand-
ing business with existing major clients, in order to increase the
sales ratio for small- and medium-size LCDs. For large-size LCDs,
meanwhile, we will work to stabilize earnings by increasing the
inch size of our offerings to 70-, 80-, and 90-inch classes.
Sales by Product Group
31.6%
1,200
800
400
0
141312
Net Sales
(billions of yen)
100
0
-200
-100
141312
Operating Income (Loss)
(billions of yen)
This product group enjoyed increases in both sales and operat-
ing income thanks to growth in sales of camera modules for
smartphones and other mobile devices as well as various sen-
sors such as proximity sensors.
We will strive to further expand this business by boosting
sales of distinctive devices. We will achieve this by differentiat-
ing application products, ranging from camera modules, optical
and other sensors, touchscreen systems, power-related devices,
monitoring devices, in-vehicle devices, and medical devices to
LED devices.
10.4%
Sales by Product Group
400
300
200
100
0
141312
Net Sales
(billions of yen)
20
10
0
-10
-20
141312
Operating Income (Loss)
(billions of yen)
Annual Report 2014 19
Fiscal 2013 Review by Product Group