Sharp 2014 Annual Report Download - page 40
Download and view the complete annual report
Please find page 40 of the 2014 Sharp annual report below. You can navigate through the pages in the report by either clicking on the pages listed below, or by using the keyword search tool below to find specific information within the annual report.-
 1
1 -
2
-
3
-
4
-
5
-
6
-
7
-
8
-
9
-
10
-
11
-
12
-
13
-
14
-
15
-
16
-
17
-
18
-
19
-
20
-
21
-
22
-
23
-
24
-
25
-
26
-
27
-
28
-
29
-
 30
30 -
 31
31 -
 32
32 -
 33
33 -
 34
34 -
 35
35 -
 36
36 -
 37
37 -
 38
38 -
 39
39 -
 40
40 -
 41
41 -
 42
42 -
 43
43 -
 44
44 -
 45
45 -
 46
46 -
 47
47 -
 48
48 -
 49
49 -
 50
50 -
51
-
52
-
53
-
54
-
55
-
56
-
57
-
58
-
59
-
60
-
61
-
62
-
63
-
64
-
65
-
66
-
67
-
68
-
69
-
70
-
71
-
72
-
73
-
74
-
75
 |
 |

38 SHARP CORPORATION
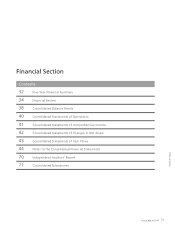
Financial Section
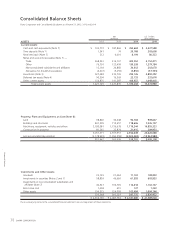
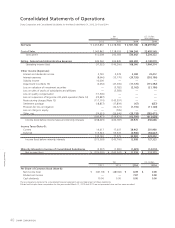
Consolidated Balance Sheets
Sharp Corporation and Consolidated Subsidiaries as of March 31, 2012, 2013 and 2014
Yen
(millions)
U.S. Dollars
(thousands)
ASSETS 2012 2013 2014 2014
Current Assets:
Cash and cash equivalents (Note 7) ¥ 193,772 ¥ 187,866 ¥ 350,634 $ 3,437,588
Time deposits (Note 7) 1,341 74 20,768 203,608
Restricted cash (Note 7) 212 4,001 8,194 80,333
Notes and accounts receivable (Note 7) —
Trade 368,561 416,107 423,552 4,152,471
Other 76,730 122,499 130,538 1,279,784
Nonconsolidated subsidiaries and affiliates 12,164 24,882 20,612 202,078
Allowance for doubtful receivables (4,407) (5,259) (5,850) (57,353)
Inventories (Note 3) 527,483 310,709 295,126 2,893,392
Deferred tax assets (Note 4) 90,394 19,369 23,733 232,676
Other current assets 154,875 141,587 106,937 1,048,403
Total current assets 1,421,125 1,221,835 1,374,244 13,472,980
Property, Plant and Equipment, at Cost (Note 6):
Land 98,840 94,448 92,784 909,647
Buildings and structures 841,205 713,657 718,606 7,045,157
Machinery, equipment, vehicles and others 2,030,081 1,726,978 1,719,244 16,855,333
Construction in progress 81,245 22,874 21,415 209,951
3,051,371 2,557,957 2,552,049 25,020,088
Less accumulated depreciation (2,178,929) (1,994,258) (2,032,348) (19,924,980)
872,442 563,699 519,701 5,095,108
Investments and Other Assets:
Goodwill 23,129 21,064 11,103 108,853
Investments in securities (Notes 2 and 7) 58,859 49,666 61,593 603,853
Investments in nonconsolidated subsidiaries and
affiliates (Note 7) 40,547 106,790 112,418 1,102,137
Bond issue cost 1,458 610 137 1,343
Other assets 196,575 124,099 102,484 1,004,746
320,568 302,229 287,735 2,820,932
¥ 2,614,135 ¥ 2,087,763 ¥ 2,181,680 $ 21,389,020
The accompanying notes to the consolidated financial statements are an integral part of these statements.