Sharp 2014 Annual Report Download - page 37
Download and view the complete annual report
Please find page 37 of the 2014 Sharp annual report below. You can navigate through the pages in the report by either clicking on the pages listed below, or by using the keyword search tool below to find specific information within the annual report.-
 1
1 -
2
-
3
-
4
-
5
-
6
-
7
-
8
-
9
-
10
-
11
-
12
-
13
-
14
-
15
-
16
-
17
-
18
-
19
-
20
-
21
-
22
-
23
-
24
-
25
-
26
-
 27
27 -
 28
28 -
 29
29 -
 30
30 -
 31
31 -
 32
32 -
 33
33 -
 34
34 -
 35
35 -
 36
36 -
 37
37 -
 38
38 -
 39
39 -
 40
40 -
 41
41 -
 42
42 -
 43
43 -
 44
44 -
 45
45 -
 46
46 -
 47
47 -
48
-
49
-
50
-
51
-
52
-
53
-
54
-
55
-
56
-
57
-
58
-
59
-
60
-
61
-
62
-
63
-
64
-
65
-
66
-
67
-
68
-
69
-
70
-
71
-
72
-
73
-
74
-
75
 |
 |
Annual Report 2014 35
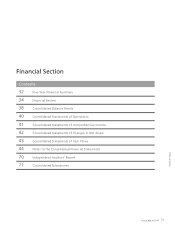
Financial Section
[Reference Information]
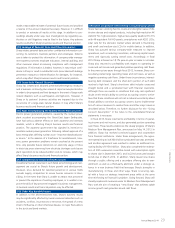
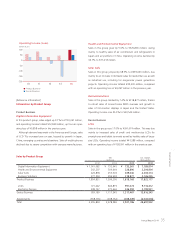
Information by Product Group
Product Business
Digital Information Equipment
In this product group, sales edged up 0.1% to ¥733,361 million,
and operating income totaled ¥12,840 million, up from an oper-
ating loss of ¥9,858 million in the previous year.
Although demand was weak in the Americas and Europe, sales
of LCD TVs increased year on year, buoyed by growth in Japan,
China, emerging countries and elsewhere. Sales of mobile phones
declined due to severe competition with overseas manufacturers.
Health and Environmental Equipment
Sales in this group grew by 5.6% to ¥326,890 million, owing
mainly to healthy sales of air conditioners and refrigerators in
Japan and air purifiers in China. Operating income declined by
34.7% to ¥21,018 million.
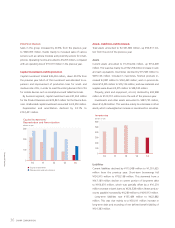
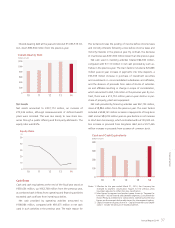
Solar Cells
Sales in this group jumped by 68.9% to ¥439,040 million, due
mainly to an increase in domestic sales for residential use as well
as industrial use, including for mega-solar power generation
projects. Operating income totaled ¥32,400 million, compared
with an operating loss of ¥4,497 million in the previous year.
Business Solutions
Sales in this group climbed by 7.4% to ¥318,877 million, thanks
to robust sales of monochrome MFPs overseas and growth in
sales of information displays in Japan and the United States.
Operating income rose 25.5% to ¥30,544 million.
Device Business
LCDs
Sales in this group rose 17.0% to ¥991,074 million. This was due
mainly to increased sales of small- and medium-size LCDs for
smartphones and tablet terminals as well as healthy sales of large-
size LCDs. Operating income totaled ¥41,588 million, compared
with an operating loss of ¥138,991 million in the previous year.
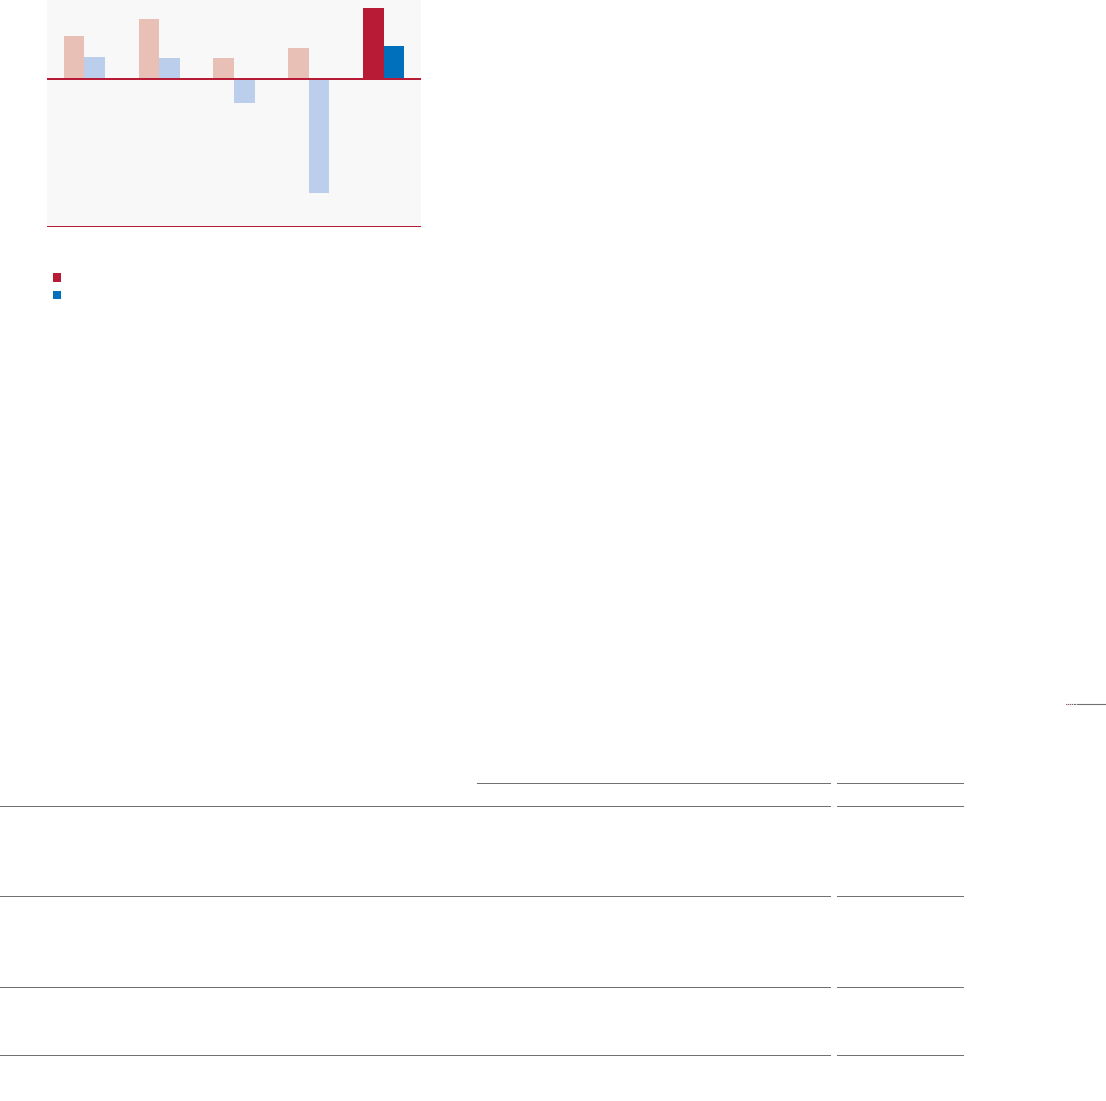
-200
-150
-100
-50
0
50
100
10 11 12 13 14
Product Business
Device Business
Operating Income (Loss)
(billions of yen)
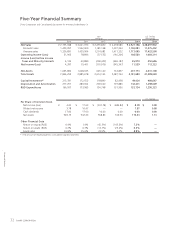
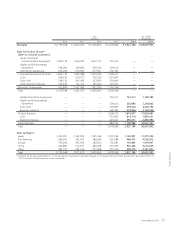
Sales by Product Group Yen
(millions)
U.S. Dollars
(thousands)
2012 2013 2014 2014
Digital Information Equipment ¥ 1,061,082 ¥ 732,645 ¥ 733,361 $ 7,189,814
Health and Environmental Equipment 292,297 309,664 326,890 3,204,804
Solar Cells 223,878 259,903 439,040 4,304,314
Business Solutions 277,594 296,993 318,877 3,126,245
Product Business 1,854,851 1,599,205 1,818,168 17,825,177
LCDs 721,042 846,879 991,074 9,716,412
Electronic Devices 238,147 270,666 326,393 3,199,931
Device Business 959,189 1,117,545 1,317,467 12,916,343
Adjustments (358,190) (238,164) (208,449) (2,043,618)
Total 2,455,850 2,478,586 2,927,186 28,697,902