Sharp 2014 Annual Report Download - page 41
Download and view the complete annual report
Please find page 41 of the 2014 Sharp annual report below. You can navigate through the pages in the report by either clicking on the pages listed below, or by using the keyword search tool below to find specific information within the annual report.-
 1
1 -
2
-
3
-
4
-
5
-
6
-
7
-
8
-
9
-
10
-
11
-
12
-
13
-
14
-
15
-
16
-
17
-
18
-
19
-
20
-
21
-
22
-
23
-
24
-
25
-
26
-
27
-
28
-
29
-
30
-
 31
31 -
 32
32 -
 33
33 -
 34
34 -
 35
35 -
 36
36 -
 37
37 -
 38
38 -
 39
39 -
 40
40 -
 41
41 -
 42
42 -
 43
43 -
 44
44 -
 45
45 -
 46
46 -
 47
47 -
 48
48 -
 49
49 -
 50
50 -
 51
51 -
52
-
53
-
54
-
55
-
56
-
57
-
58
-
59
-
60
-
61
-
62
-
63
-
64
-
65
-
66
-
67
-
68
-
69
-
70
-
71
-
72
-
73
-
74
-
75
 |
 |

Annual Report 2014 39
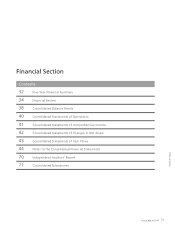
Financial Section
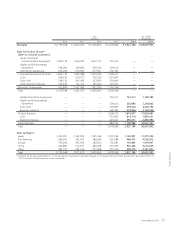
Yen
(millions)
U.S. Dollars
(thousands)
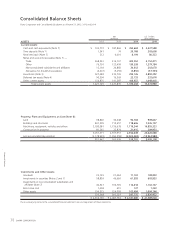
LIABILITIES AND NET ASSETS 2012 2013 2014 2014
Current Liabilities:
Short-term borrowings, including current portion of
long-term debt (Notes 5 and 7) ¥ 597,997 ¥ 924,113 ¥ 793,198 $ 7,776,451
Notes and accounts payable (Note 7) —
Trade 384,322 341,351 347,175 3,403,676
Construction and other 47,804 40,616 35,892 351,882
Nonconsolidated subsidiaries and affiliates 4,447 23,657 26,846 263,196
Accrued expenses 195,506 240,394 235,203 2,305,912
Income taxes (Note 4) 5,963 6,206 22,056 216,235
Other current liabilities (Note 4) 155,041 91,196 91,255 894,658
Total current liabilities 1,391,080 1,667,533 1,551,625 15,212,010
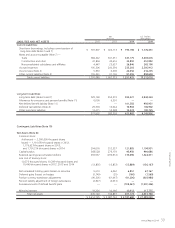
Long-term Liabilities:
Long-term debt (Notes 5 and 7) 529,160 250,310 300,321 2,944,324
Allowance for severance and pension benefits (Note 11) 6,000 6,501 — —
Net defined benefit liability (Note 11) — — 101,383 993,951
Deferred tax liabilities (Note 4) 29,304 14,044 10,904 106,902
Other long-term liabilities 13,471 14,538 10,274 100,725
577,935 285,393 422,882 4,145,902
Contingent Liabilities (Note 10)
Net Assets (Note 8):
Common stock:
Authorized — 2,500,000 thousand shares
Issued — 1,110,699 thousand shares in 2012,
1,176,623 thousand shares in 2013,
and 1,701,214 thousand shares in 2014 204,676 212,337 121,885 1,194,951
Capital surplus 268,528 276,179 95,950 940,686
Retained earnings (accumulated deficits) 259,937 (290,912) 135,096 1,324,471
Less cost of treasury stock:
10,375 thousand shares, 10,399 thousand shares and
10,449 thousand shares in 2012, 2013 and 2014 (13,876) (13,872) (13,889) (136,167)
Net unrealized holding gains (losses) on securities 5,610 6,062 6,851 67,167
Deferred gains (losses) on hedges (5,749) (25) (160) (1,569)
Foreign currency translation adjustments (90,305) (61,467) (41,206) (403,980)
Pension liability adjustment of foreign subsidiaries (2,927) (3,631) — —
Remeasurements of defined benefit plans — — (109,367) (1,072,226)
Minority interests 19,226 10,166 12,013 117,775
Total net assets 645,120 134,837 207,173 2,031,108
¥ 2,614,135 ¥ 2,087,763 ¥ 2,181,680 $ 21,389,020