Seagate 2014 Annual Report Download - page 50
Download and view the complete annual report
Please find page 50 of the 2014 Seagate annual report below. You can navigate through the pages in the report by either clicking on the pages listed below, or by using the keyword search tool below to find specific information within the annual report.-
 1
1 -
2
-
3
-
4
-
5
-
6
-
7
-
8
-
9
-
10
-
11
-
12
-
13
-
14
-
15
-
16
-
17
-
18
-
19
-
20
-
21
-
22
-
23
-
24
-
25
-
26
-
27
-
28
-
29
-
30
-
31
-
32
-
33
-
34
-
35
-
36
-
37
-
38
-
39
-
 40
40 -
 41
41 -
 42
42 -
 43
43 -
 44
44 -
 45
45 -
 46
46 -
 47
47 -
 48
48 -
 49
49 -
 50
50 -
 51
51 -
 52
52 -
 53
53 -
 54
54 -
 55
55 -
 56
56 -
 57
57 -
 58
58 -
 59
59 -
 60
60 -
61
-
62
-
63
-
64
-
65
-
66
-
67
-
68
-
69
-
70
-
71
-
72
-
73
-
74
-
75
-
76
-
77
-
78
-
79
-
80
-
81
-
82
-
83
-
84
-
85
-
86
-
87
-
88
-
89
-
90
-
91
-
92
-
93
-
94
-
95
-
96
-
97
-
98
-
99
-
100
-
101
-
102
-
103
-
104
-
105
-
106
-
107
-
108
-
109
-
110
-
111
-
112
-
113
-
114
-
115
-
116
-
117
-
118
-
119
-
120
-
121
-
122
-
123
-
124
-
125
-
126
-
127
-
128
-
129
-
130
-
131
-
132
-
133
-
134
-
135
-
136
-
137
-
138
-
139
-
140
-
141
-
142
-
143
-
144
-
145
-
146
-
147
-
148
 |
 |

TableofContents
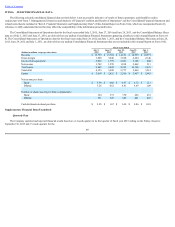
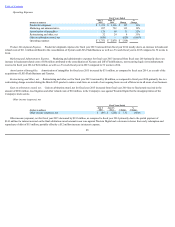
Thefollowingtablesummarizesinformationregardingaveragedrivesellingprices("ASPs")excludingstoragesystems;drivevolumeshipments,exabytes
shipped,andrevenuesbychannelandgeography:
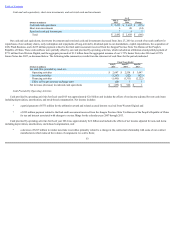
FiscalYear2015ComparedtoFiscalYear2014
Revenue
Revenueinfiscalyear2015remainedflatfromfiscalyear2014,asaresultofrevenuecontributedfromouracquisitionsofXyratexandLSI'sFlashBusiness
andafavorableproductmix,partiallyoffsetbya4%decreaseinunitsshippedandmoderatepriceerosion.
CostofRevenueandGrossMargin
Forfiscalyear2015,grossmarginasapercentageofrevenueremainedflatfromthepriorfiscalyearasaresultofimprovedproductmixandcostsavingsdue
toincreasedoperationalefficiencies,offsetbymoderatepriceerosion.
47
FiscalYearsEnded
(Inmillions,exceptpercentages,exabytesandASPs)
July3,
2015
June27,
2014
June28,
2013
UnitShipments:
Enterprise 36 31 30
ClientCompute 132 144 151
ClientNon-Compute 44 45 45
TotalUnitsShipped 212 220 226
ASPs(perunit) $ 61 $ 61 $ 63
ExabytesShipped 228 202 185
RevenuesbyChannel(%)
OEMs 71% 68% 68%
Distributors 17% 20% 21%
Retailers 12% 12% 11%
RevenuesbyGeography(%)
Americas 28% 27% 27%
EMEA 17% 19% 19%
AsiaPacific 55% 54% 54%
FiscalYearsEnded
(Dollarsinmillions)
July3,
2015
June27,
2014 Change
%
Change
Revenue $ 13,739 $ 13,724 $ 15 0.1%
FiscalYearsEnded
(Dollarsinmillions)
July3,
2015
June27,
2014 Change
%
Change
Costofrevenue $ 9,930 $ 9,878 $ 52 1%
Grossmargin $ 3,809 $ 3,846 $ (37) (1)%
Grossmarginpercentage 28% 28%