Seagate 2014 Annual Report Download - page 49
Download and view the complete annual report
Please find page 49 of the 2014 Seagate annual report below. You can navigate through the pages in the report by either clicking on the pages listed below, or by using the keyword search tool below to find specific information within the annual report.-
 1
1 -
2
-
3
-
4
-
5
-
6
-
7
-
8
-
9
-
10
-
11
-
12
-
13
-
14
-
15
-
16
-
17
-
18
-
19
-
20
-
21
-
22
-
23
-
24
-
25
-
26
-
27
-
28
-
29
-
30
-
31
-
32
-
33
-
34
-
35
-
36
-
37
-
38
-
 39
39 -
 40
40 -
 41
41 -
 42
42 -
 43
43 -
 44
44 -
 45
45 -
 46
46 -
 47
47 -
 48
48 -
 49
49 -
 50
50 -
 51
51 -
 52
52 -
 53
53 -
 54
54 -
 55
55 -
 56
56 -
 57
57 -
 58
58 -
 59
59 -
60
-
61
-
62
-
63
-
64
-
65
-
66
-
67
-
68
-
69
-
70
-
71
-
72
-
73
-
74
-
75
-
76
-
77
-
78
-
79
-
80
-
81
-
82
-
83
-
84
-
85
-
86
-
87
-
88
-
89
-
90
-
91
-
92
-
93
-
94
-
95
-
96
-
97
-
98
-
99
-
100
-
101
-
102
-
103
-
104
-
105
-
106
-
107
-
108
-
109
-
110
-
111
-
112
-
113
-
114
-
115
-
116
-
117
-
118
-
119
-
120
-
121
-
122
-
123
-
124
-
125
-
126
-
127
-
128
-
129
-
130
-
131
-
132
-
133
-
134
-
135
-
136
-
137
-
138
-
139
-
140
-
141
-
142
-
143
-
144
-
145
-
146
-
147
-
148
 |
 |

TableofContents
acquisitionofcertainassetsandliabilitiesofLSICorporation's("LSI")AcceleratedSolutionsDivisionandFlashComponentsDivision(collectively,the"Flash
Business")fromAvagoTechnologiesLimitedfor$450millionincash.
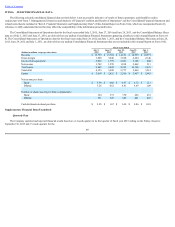
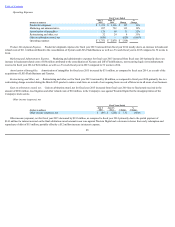
ResultsofOperations
WelistinthetablesbelowsummarizedinformationfromourConsolidatedStatementsofOperationsbydollarsandasapercentageofrevenue:
46
FiscalYearsEnded
(Dollarsinmillions)
July3,
2015
June27,
2014
June28,
2013
Revenue $ 13,739 $ 13,724 $ 14,351
Costofrevenue 9,930 9,878 10,411
Grossmargin 3,809 3,846 3,940
Productdevelopment 1,353 1,226 1,133
Marketingandadministrative 857 722 635
Amortizationofintangibles 129 98 79
Restructuringandother,net 32 24 2
Gainonarbitrationaward,net (620) — —
Incomefromoperations 2,058 1,776 2,091
Otherincome(expense),net (88) (220) (260)
Incomebeforeincometaxes 1,970 1,556 1,831
Provisionfor(benefitfrom)incometaxes 228 (14) (7)
Netincome $ 1,742 $ 1,570 $ 1,838
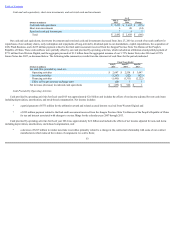
FiscalYearsEnded
July3,
2015
June27,
2014
June28,
2013
Revenue 100% 100% 100%
Costofrevenue 72 72 73
Grossmargin 28 28 27
Productdevelopment 10 9 8
Marketingandadministrative 7 5 4
Amortizationofintangibles 1 1 1
Restructuringandother,net — — —
Gainonarbitrationaward,net (5) — —
Incomefromoperations 15 13 14
Otherincome(expense),net (1) (2) (2)
Incomebeforeincometaxes 14 11 12
Provisionfor(benefitfrom)incometaxes 2 — —
Netincome 12% 11% 12%