Seagate 2014 Annual Report Download - page 44
Download and view the complete annual report
Please find page 44 of the 2014 Seagate annual report below. You can navigate through the pages in the report by either clicking on the pages listed below, or by using the keyword search tool below to find specific information within the annual report.-
 1
1 -
2
-
3
-
4
-
5
-
6
-
7
-
8
-
9
-
10
-
11
-
12
-
13
-
14
-
15
-
16
-
17
-
18
-
19
-
20
-
21
-
22
-
23
-
24
-
25
-
26
-
27
-
28
-
29
-
30
-
31
-
32
-
33
-
 34
34 -
 35
35 -
 36
36 -
 37
37 -
 38
38 -
 39
39 -
 40
40 -
 41
41 -
 42
42 -
 43
43 -
 44
44 -
 45
45 -
 46
46 -
 47
47 -
 48
48 -
 49
49 -
 50
50 -
 51
51 -
 52
52 -
 53
53 -
 54
54 -
55
-
56
-
57
-
58
-
59
-
60
-
61
-
62
-
63
-
64
-
65
-
66
-
67
-
68
-
69
-
70
-
71
-
72
-
73
-
74
-
75
-
76
-
77
-
78
-
79
-
80
-
81
-
82
-
83
-
84
-
85
-
86
-
87
-
88
-
89
-
90
-
91
-
92
-
93
-
94
-
95
-
96
-
97
-
98
-
99
-
100
-
101
-
102
-
103
-
104
-
105
-
106
-
107
-
108
-
109
-
110
-
111
-
112
-
113
-
114
-
115
-
116
-
117
-
118
-
119
-
120
-
121
-
122
-
123
-
124
-
125
-
126
-
127
-
128
-
129
-
130
-
131
-
132
-
133
-
134
-
135
-
136
-
137
-
138
-
139
-
140
-
141
-
142
-
143
-
144
-
145
-
146
-
147
-
148
 |
 |

TableofContents
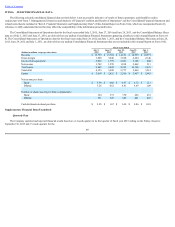
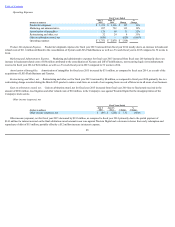
remainingquartersoffiscalyear2015aswellasallfourquartersoffiscalyear2014,whichendedontheFridayclosesttoSeptember30,December31,March31,
andJune30.
41
FiscalYear2015QuartersEnded
(Inmillions,exceptpersharedata)
July3,
2015
April3,
2015
January2,
2015
October3,
2014
Revenue $ 2,927 $ 3,330 $ 3,696 $ 3,785
Grossmargin 776 955 1,027 1,051
Incomefromoperations 206 343 1,053 456
Netincome 138 291 933 381
Netincomepershare:
Basic $ 0.44 $ 0.90 $ 2.84 $ 1.17
Diluted 0.43 0.88 2.78 1.13
FiscalYear2014QuartersEnded
(Inmillions,exceptpersharedata)
June27,
2014
March28,
2014
December27,
2013
September27,
2013
Revenue $ 3,301 $ 3,406 $ 3,528 $ 3,489
Grossmargin 925 959 987 975
Incomefromoperations 410 444 444 478
Netincome 320 395 428 427
Netincomepershare:
Basic $ 0.98 $ 1.21 $ 1.27 $ 1.20
Diluted 0.95 1.17 1.24 1.16