Seagate 2003 Annual Report Download - page 87
Download and view the complete annual report
Please find page 87 of the 2003 Seagate annual report below. You can navigate through the pages in the report by either clicking on the pages listed below, or by using the keyword search tool below to find specific information within the annual report.-
 1
1 -
2
-
3
-
4
-
5
-
6
-
7
-
8
-
9
-
10
-
11
-
12
-
13
-
14
-
15
-
16
-
17
-
18
-
19
-
20
-
21
-
22
-
23
-
24
-
25
-
26
-
27
-
28
-
29
-
30
-
31
-
32
-
33
-
34
-
35
-
36
-
37
-
38
-
39
-
40
-
41
-
42
-
43
-
44
-
45
-
46
-
47
-
48
-
49
-
50
-
51
-
52
-
53
-
54
-
55
-
56
-
57
-
58
-
59
-
60
-
61
-
62
-
63
-
64
-
65
-
66
-
67
-
68
-
69
-
70
-
71
-
72
-
73
-
74
-
75
-
76
-
 77
77 -
 78
78 -
 79
79 -
 80
80 -
 81
81 -
 82
82 -
 83
83 -
 84
84 -
 85
85 -
 86
86 -
 87
87 -
 88
88 -
 89
89 -
 90
90 -
 91
91 -
 92
92 -
 93
93 -
 94
94 -
 95
95 -
 96
96 -
 97
97 -
98
-
99
-
100
-
101
-
102
-
103
-
104
-
105
-
106
-
107
-
108
-
109
-
110
-
111
-
112
-
113
-
114
-
115
-
116
-
117
-
118
-
119
-
120
-
121
-
122
-
123
 |
 |
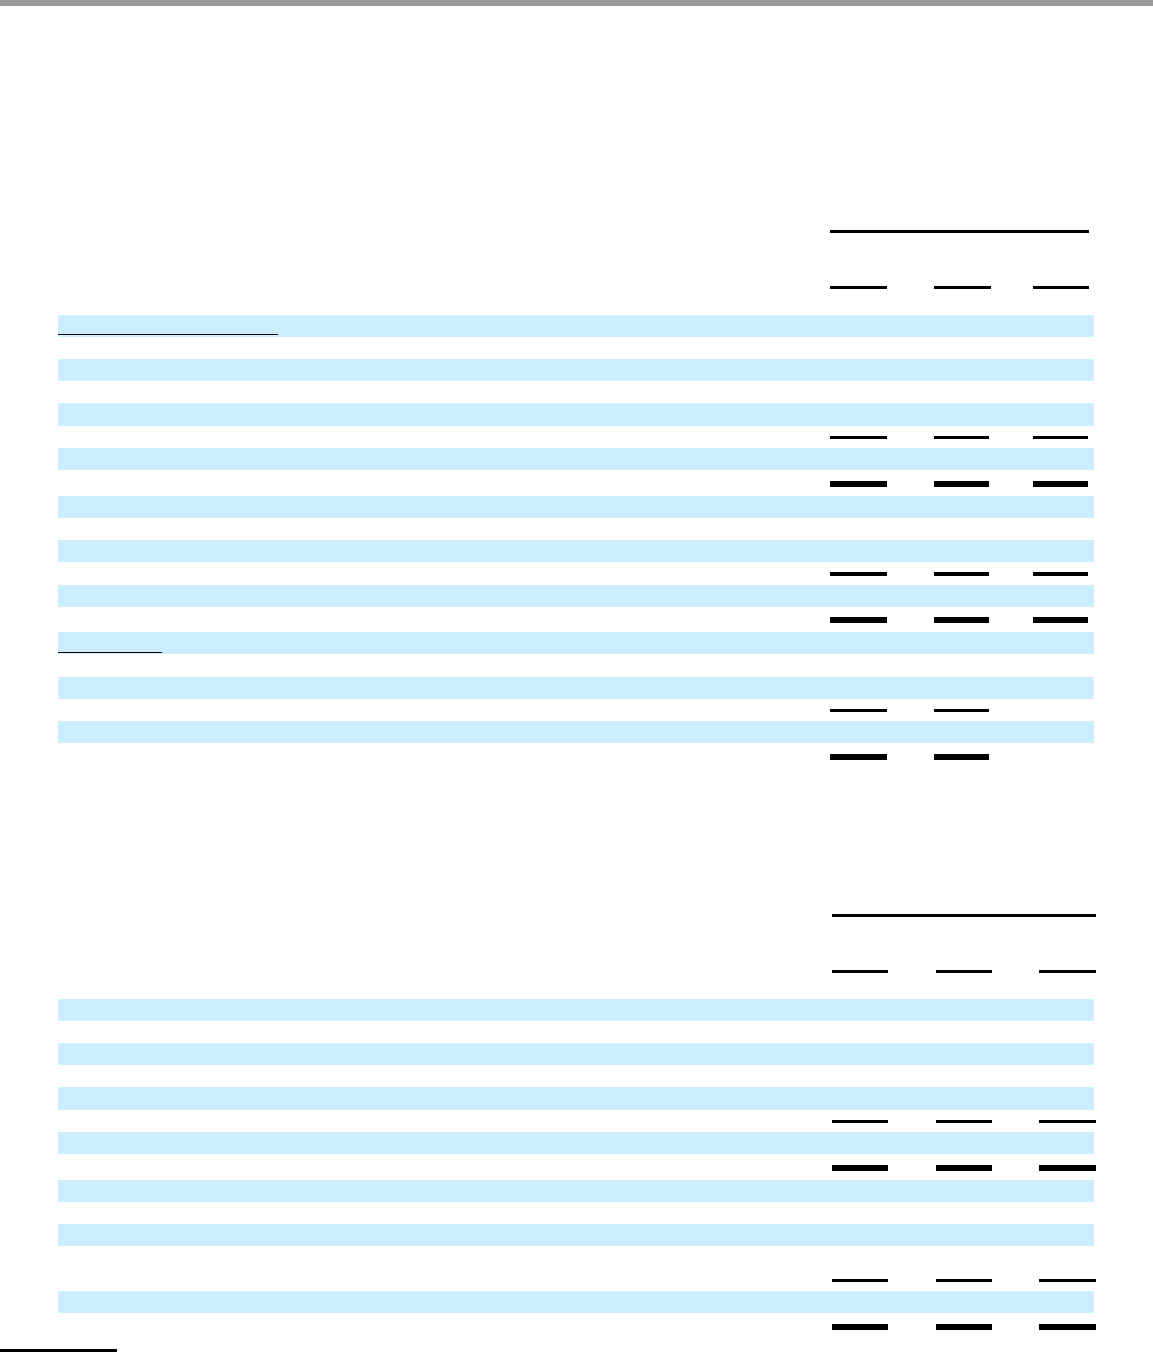
Table of Contents
SEAGATE TECHNOLOGY
NOTES TO CONSOLIDATED FINANCIAL STATEMENTS—(Continued)
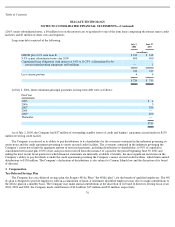
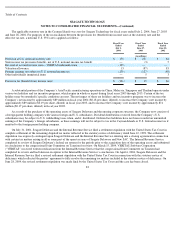
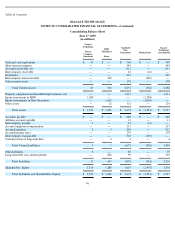
The following tables summarize the Company’s operations by business segment:
On a separate basis, in conformity with accounting principles generally accepted in the United States, XIOtech had net losses of $9
million and $51 million in fiscal years 2003 and 2002, respectively.
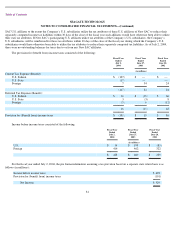
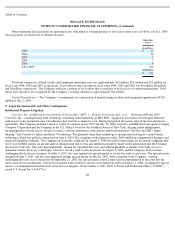
The following table summarizes the Company’s operations by geographic area:
86
Fiscal Years Ended
July 2,
2004
June 27,
2003
June 28,
2002
(in millions)
Revenue and Gross Profit
Revenue:
Rigid Disc Drives
$
6,224
$
6,464
$
6,023
Other
—
24
74
Eliminations
—
(
2
)
(10
)
Consolidated
$
6,224
$
6,486
$
6,087
Gross Profit:
Rigid Disc Drives
$
1,459
$
1,715
$
1,558
Other
—
12
35
Consolidated
$
1,459
$
1,727
$
1,593
Total Assets
Rigid Disc Drives
$
3,942
$
3,522
Eliminations
—
(
5
)
Consolidated
$
3,942
$
3,517
Fiscal Years Ended
July 2,
2004
June 27,
2003
June 28,
2002
(in millions)
Revenue from external customers (1):
United States
$
1,866
$
2,151
$
2,398
The Netherlands
1,558
1,562
1,438
Singapore
2,319
2,137
1,627
Other
481
636
624
Consolidated
$
6,224
$
6,486
$
6,087
Long
-
lived assets:
United States
$
574
$
504
$
805
Singapore
438
287
204
Other
469
444
124
Consolidated
$
1,481
$
1,235
$
1,133
(1)
Revenue is attributed to countries based on the shipping location.