Seagate 2003 Annual Report Download - page 28
Download and view the complete annual report
Please find page 28 of the 2003 Seagate annual report below. You can navigate through the pages in the report by either clicking on the pages listed below, or by using the keyword search tool below to find specific information within the annual report.-
 1
1 -
2
-
3
-
4
-
5
-
6
-
7
-
8
-
9
-
10
-
11
-
12
-
13
-
14
-
15
-
16
-
17
-
 18
18 -
 19
19 -
 20
20 -
 21
21 -
 22
22 -
 23
23 -
 24
24 -
 25
25 -
 26
26 -
 27
27 -
 28
28 -
 29
29 -
 30
30 -
 31
31 -
 32
32 -
 33
33 -
 34
34 -
 35
35 -
 36
36 -
 37
37 -
 38
38 -
39
-
40
-
41
-
42
-
43
-
44
-
45
-
46
-
47
-
48
-
49
-
50
-
51
-
52
-
53
-
54
-
55
-
56
-
57
-
58
-
59
-
60
-
61
-
62
-
63
-
64
-
65
-
66
-
67
-
68
-
69
-
70
-
71
-
72
-
73
-
74
-
75
-
76
-
77
-
78
-
79
-
80
-
81
-
82
-
83
-
84
-
85
-
86
-
87
-
88
-
89
-
90
-
91
-
92
-
93
-
94
-
95
-
96
-
97
-
98
-
99
-
100
-
101
-
102
-
103
-
104
-
105
-
106
-
107
-
108
-
109
-
110
-
111
-
112
-
113
-
114
-
115
-
116
-
117
-
118
-
119
-
120
-
121
-
122
-
123
 |
 |

Table of Contents
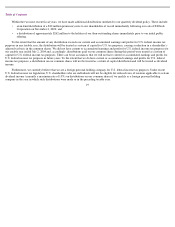
approximately one million units lower than the March quarter. To the extent that our distributor customers reduce their purchases of our
products or prices decline significantly in the distribution channel, our results of operations would be adversely affected.
During periods of slowing growth of areal density and longer product cycles we may experience heightened pricing pressures. This
pricing pressure has contributed to a reduction in gross margins. To the extent that these pricing pressures continue, our gross margin may be
negatively affected. Furthermore, the favorable impact of new product introductions on our results of operations may be minimized.
Historically, the introduction of new products generally has had a favorable impact on our results of operations both because the new products
are introduced at higher prices than existing competitive offerings and because advances in areal density technology have enabled lower
manufacturing costs through reduction in components such as read/write heads and rigid discs. However, in contrast to when the rate of growth
in areal density is increasing, a slowing growth rate in areal density can limit the cost benefits of new products because it is technologically
more difficult to reduce the number of read/write heads and rigid discs in a particular drive. In addition, given the environment of intense price
competition, in the absence of significant capacity increases or improvements in reliability, it is difficult to obtain higher prices for new
products.
We believe that we and the hard drive industry are in a unique and challenging period of time with longer product cycles, continued
aggressive pricing in the core markets and ongoing changes in how we serve our distribution channel partners. All of these may impact our
near-term profitability. In our fourth fiscal quarter of 2004, we undertook significant restructuring activities to reduce the costs of our
operations in light of our declining revenue, gross margins, and earnings over the past several quarters resulting from recent significant price
erosion and market share variability, particularly with respect to our enterprise disc drive products. We continue to look at opportunities for
further cost reductions which may result in additional restructuring activities and restructuring charges in the future. During this challenging
period, the management team will continue to be intensely focused on maintaining profitability excluding the impact of any restructuring
charges that we may incur.
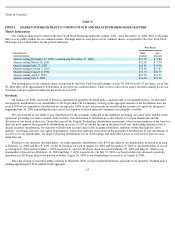
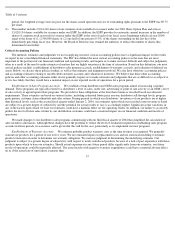
Results of Operations
We list in the tables below the historical consolidated statements of operations in dollars and as a percentage of revenue for the fiscal
years indicated.
27
Fiscal Year Ended
July 2,
2004
June 27,
2003
June 28,
2002
(in millions)
Revenue
$
6,224
$
6,486
$
6,087
Cost of revenue
4,765
4,759
4,494
Gross margin
1,459
1,727
1,593
Product development
666
670
698
Marketing and administrative
290
357
498
Amortization of intangibles
—
—
19
Restructuring
59
9
4
Income from operations
444
691
374
Other income (expense), net
(16
)
(31
)
(135
)
Income before income taxes
428
660
239
Provision for (benefit from) income taxes
(101
)
19
86
Net income
$
529
$
641
$
153