Salesforce.com 2012 Annual Report Download - page 75
Download and view the complete annual report
Please find page 75 of the 2012 Salesforce.com annual report below. You can navigate through the pages in the report by either clicking on the pages listed below, or by using the keyword search tool below to find specific information within the annual report.-
 1
1 -
2
-
3
-
4
-
5
-
6
-
7
-
8
-
9
-
10
-
11
-
12
-
13
-
14
-
15
-
16
-
17
-
18
-
19
-
20
-
21
-
22
-
23
-
24
-
25
-
26
-
27
-
28
-
29
-
30
-
31
-
32
-
33
-
34
-
35
-
36
-
37
-
38
-
39
-
40
-
41
-
42
-
43
-
44
-
45
-
46
-
47
-
48
-
49
-
50
-
51
-
52
-
53
-
54
-
55
-
56
-
57
-
58
-
59
-
60
-
61
-
62
-
63
-
64
-
 65
65 -
 66
66 -
 67
67 -
 68
68 -
 69
69 -
 70
70 -
 71
71 -
 72
72 -
 73
73 -
 74
74 -
 75
75 -
 76
76 -
 77
77 -
 78
78 -
 79
79 -
 80
80 -
 81
81 -
 82
82 -
 83
83 -
 84
84 -
 85
85 -
86
-
87
-
88
-
89
-
90
-
91
-
92
-
93
-
94
-
95
-
96
-
97
-
98
-
99
-
100
-
101
-
102
-
103
-
104
-
105
-
106
-
107
-
108
-
109
-
110
-
111
-
112
-
113
-
114
-
115
-
116
-
117
-
118
-
119
-
120
 |
 |

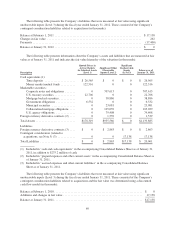
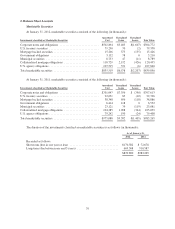
The Company’s fair value of its outstanding derivative instruments are summarized below (in thousands):
Fair Value of Derivative Instruments
Balance Sheet Location
As of January 31,
2012
As of January 31,
2011
Derivative Assets
Derivatives not designated as hedging instruments:
Foreign currency derivative contracts ........ Prepaid expenses and
other current assets $ 621 $1,539
Derivative Liabilities
Derivatives not designated as hedging instruments:
Foreign currency derivative contracts ........ Accrued expenses and
other current liabilities $2,551 $2,863
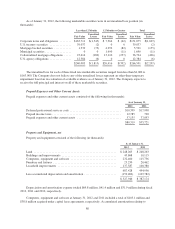
The effect of the derivative instruments not designated as hedging instruments on the consolidated
statements of operations for the years ended January 31, 2012, 2011 and 2010, respectively are summarized
below (in thousands):
Derivatives Not Designated as Hedging Instruments Gains (Losses) Recognized in Income on Derivative Instruments
Year ended January 31,
Location 2012 2011 2010
Foreign currency derivative contracts ........... Other expense $(1,930) $(1,324) $1,191
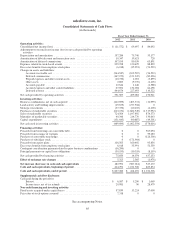
Investment Income
Investment income consists of interest income, realized gains, and realized losses on the Company’s cash,
cash equivalents and marketable securities. The components of investment income are presented below (in
thousands):
Fiscal Year Ended January 31,
2012 2011 2010
Interest income ................................ $20,791 $28,273 $21,219
Realized gains ................................. 6,542 12,460 13,391
Realized losses ................................. (4,065) (2,998) (4,202)
Total investment income ......................... $23,268 $37,735 $30,408
Interest Expense
Interest expense consists of interest on the Company’s capital lease commitments and 0.75% convertible
senior notes (the “Notes”), net of amounts capitalized. As described in Note 2, in accounting for the Notes at the
time of issuance in January 2010, the carrying amount of the liability component was calculated by measuring
the fair value of a similar liability that did not have an associated convertible feature. The excess of the principal
amount of the liability component over its carrying amount (“debt discount”) is amortized, using an effective
interest rate of 5.86%, to interest expense over the term of the Notes.
71