Salesforce.com 2012 Annual Report Download - page 67
Download and view the complete annual report
Please find page 67 of the 2012 Salesforce.com annual report below. You can navigate through the pages in the report by either clicking on the pages listed below, or by using the keyword search tool below to find specific information within the annual report.-
 1
1 -
2
-
3
-
4
-
5
-
6
-
7
-
8
-
9
-
10
-
11
-
12
-
13
-
14
-
15
-
16
-
17
-
18
-
19
-
20
-
21
-
22
-
23
-
24
-
25
-
26
-
27
-
28
-
29
-
30
-
31
-
32
-
33
-
34
-
35
-
36
-
37
-
38
-
39
-
40
-
41
-
42
-
43
-
44
-
45
-
46
-
47
-
48
-
49
-
50
-
51
-
52
-
53
-
54
-
55
-
56
-
 57
57 -
 58
58 -
 59
59 -
 60
60 -
 61
61 -
 62
62 -
 63
63 -
 64
64 -
 65
65 -
 66
66 -
 67
67 -
 68
68 -
 69
69 -
 70
70 -
 71
71 -
 72
72 -
 73
73 -
 74
74 -
 75
75 -
 76
76 -
 77
77 -
78
-
79
-
80
-
81
-
82
-
83
-
84
-
85
-
86
-
87
-
88
-
89
-
90
-
91
-
92
-
93
-
94
-
95
-
96
-
97
-
98
-
99
-
100
-
101
-
102
-
103
-
104
-
105
-
106
-
107
-
108
-
109
-
110
-
111
-
112
-
113
-
114
-
115
-
116
-
117
-
118
-
119
-
120
 |
 |

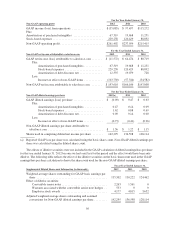
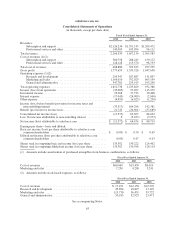
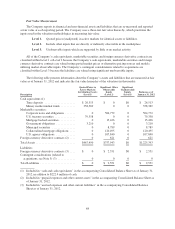
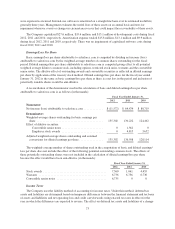
salesforce.com, inc.
Consolidated Statements of Operations
(in thousands, except per share data)
Fiscal Year Ended January 31,
2012 2011 2010
Revenues:
Subscription and support .................................. $2,126,234 $1,551,145 $1,209,472
Professional services and other ............................. 140,305 105,994 96,111
Total revenues .............................................. 2,266,539 1,657,139 1,305,583
Cost of revenues (1)(2):
Subscription and support .................................. 360,758 208,243 159,172
Professional services and other ............................. 128,128 115,570 98,753
Total cost of revenues ........................................ 488,886 323,813 257,925
Gross profit ................................................ 1,777,653 1,333,326 1,047,658
Operating expenses (1)(2):
Research and development ................................ 295,347 187,887 131,897
Marketing and sales ...................................... 1,169,610 792,029 605,199
General and administrative ................................ 347,781 255,913 195,290
Total operating expenses ...................................... 1,812,738 1,235,829 932,386
Income (loss) from operations ................................. (35,085) 97,497 115,272
Investment income .......................................... 23,268 37,735 30,408
Interest expense ............................................. (17,045) (24,909) (2,000)
Other expense .............................................. (4,455) (6,025) (1,299)
Income (loss) before benefit (provision) for income taxes and
noncontrolling interest ..................................... (33,317) 104,298 142,381
Benefit (provision) for income taxes ............................. 21,745 (34,601) (57,689)
Consolidated net income (loss) ................................. (11,572) 69,697 84,692
Less: Net income attributable to noncontrolling interest ............. 0 (5,223) (3,973)
Net income (loss) attributable to salesforce.com ................... $ (11,572) $ 64,474 $ 80,719
Earnings per share—basic and diluted:
Basic net income (loss) per share attributable to salesforce.com
common shareholders ...................................... $ (0.09) $ 0.50 $ 0.65
Diluted net income (loss) per share attributable to salesforce.com
common shareholders ...................................... (0.09) 0.47 0.63
Shares used in computing basic net income (loss) per share .......... 135,302 130,222 124,462
Shares used in computing diluted net income (loss) per share ......... 135,302 136,598 128,114
(1) Amounts include amortization of purchased intangibles from business combinations, as follows:
Fiscal Year Ended January 31,
2012 2011 2010
Cost of revenues .............................................. $60,069 $15,459 $8,010
Marketing and sales ........................................... 7,250 4,209 3,241
(2) Amounts include stock-based expenses, as follows:
Fiscal Year Ended January 31,
2012 2011 2010
Cost of revenues .............................................. $ 17,451 $12,158 $12,570
Research and development ...................................... 45,894 18,897 13,129
Marketing and sales ........................................... 115,730 56,451 39,722
General and administrative ..................................... 50,183 32,923 23,471
See accompanying Notes.
63