Salesforce.com 2012 Annual Report Download - page 47
Download and view the complete annual report
Please find page 47 of the 2012 Salesforce.com annual report below. You can navigate through the pages in the report by either clicking on the pages listed below, or by using the keyword search tool below to find specific information within the annual report.-
 1
1 -
2
-
3
-
4
-
5
-
6
-
7
-
8
-
9
-
10
-
11
-
12
-
13
-
14
-
15
-
16
-
17
-
18
-
19
-
20
-
21
-
22
-
23
-
24
-
25
-
26
-
27
-
28
-
29
-
30
-
31
-
32
-
33
-
34
-
35
-
36
-
 37
37 -
 38
38 -
 39
39 -
 40
40 -
 41
41 -
 42
42 -
 43
43 -
 44
44 -
 45
45 -
 46
46 -
 47
47 -
 48
48 -
 49
49 -
 50
50 -
 51
51 -
 52
52 -
 53
53 -
 54
54 -
 55
55 -
 56
56 -
 57
57 -
58
-
59
-
60
-
61
-
62
-
63
-
64
-
65
-
66
-
67
-
68
-
69
-
70
-
71
-
72
-
73
-
74
-
75
-
76
-
77
-
78
-
79
-
80
-
81
-
82
-
83
-
84
-
85
-
86
-
87
-
88
-
89
-
90
-
91
-
92
-
93
-
94
-
95
-
96
-
97
-
98
-
99
-
100
-
101
-
102
-
103
-
104
-
105
-
106
-
107
-
108
-
109
-
110
-
111
-
112
-
113
-
114
-
115
-
116
-
117
-
118
-
119
-
120
 |
 |

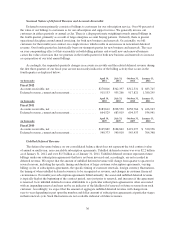
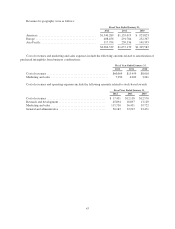
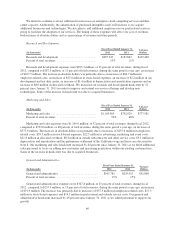
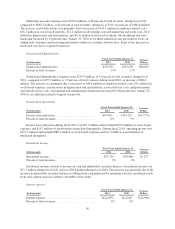
Revenues by geography were as follows:
Fiscal Year Ended January 31,
2012 2011 2010
Americas ....................................... $1,540,289 $1,135,019 $ 923,823
Europe ......................................... 408,456 291,784 232,367
Asia Pacific ..................................... 317,794 230,336 149,393
$2,266,539 $1,657,139 $1,305,583
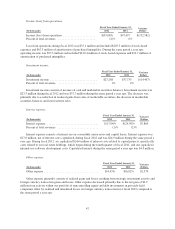
Cost of revenues and marketing and sales expenses include the following amounts related to amortization of
purchased intangibles from business combinations:
Fiscal Year Ended January 31,
2012 2011 2010
Cost of revenues .......................................... $60,069 $15,459 $8,010
Marketing and sales ....................................... 7,250 4,209 3,241
Cost of revenues and operating expenses include the following amounts related to stock-based awards:
Fiscal Year Ended January 31,
2012 2011 2010
Cost of revenues ........................................ $ 17,451 $12,158 $12,570
Research and development ................................ 45,894 18,897 13,129
Marketing and sales ..................................... 115,730 56,451 39,722
General and administrative ............................... 50,183 32,923 23,471
43