Salesforce.com 2012 Annual Report Download - page 68
Download and view the complete annual report
Please find page 68 of the 2012 Salesforce.com annual report below. You can navigate through the pages in the report by either clicking on the pages listed below, or by using the keyword search tool below to find specific information within the annual report.-
 1
1 -
2
-
3
-
4
-
5
-
6
-
7
-
8
-
9
-
10
-
11
-
12
-
13
-
14
-
15
-
16
-
17
-
18
-
19
-
20
-
21
-
22
-
23
-
24
-
25
-
26
-
27
-
28
-
29
-
30
-
31
-
32
-
33
-
34
-
35
-
36
-
37
-
38
-
39
-
40
-
41
-
42
-
43
-
44
-
45
-
46
-
47
-
48
-
49
-
50
-
51
-
52
-
53
-
54
-
55
-
56
-
57
-
 58
58 -
 59
59 -
 60
60 -
 61
61 -
 62
62 -
 63
63 -
 64
64 -
 65
65 -
 66
66 -
 67
67 -
 68
68 -
 69
69 -
 70
70 -
 71
71 -
 72
72 -
 73
73 -
 74
74 -
 75
75 -
 76
76 -
 77
77 -
 78
78 -
79
-
80
-
81
-
82
-
83
-
84
-
85
-
86
-
87
-
88
-
89
-
90
-
91
-
92
-
93
-
94
-
95
-
96
-
97
-
98
-
99
-
100
-
101
-
102
-
103
-
104
-
105
-
106
-
107
-
108
-
109
-
110
-
111
-
112
-
113
-
114
-
115
-
116
-
117
-
118
-
119
-
120
 |
 |

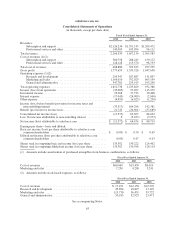
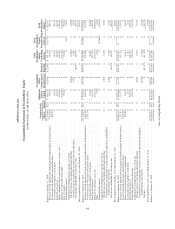
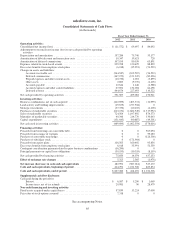
salesforce.com, inc.
Consolidated Statements of Stockholders’ Equity
(in thousands, except share data)
Common Stock Additional
Paid-in
Capital
Accumulated
Other
Comprehensive
Income/(Loss)
Retained
Earnings
Total
Stockholders’
Equity
Controlling
Interest
Total
Stockholders’
Equity
Noncontrolling
Interest
Total
Stockholders’
EquityShares Amount
Balances at January 31, 2009 .............................................122,850,062 $123 $ 648,724 $ (2,905) $ 25,842 $ 671,784 $ 10,703 $ 682,487
Exercise of stock options and stock grants to board members for board services . . . 3,472,826 4 96,153 0 0 96,157 0 96,157
Vested restricted stock units converted to shares ........................... 829,561 0 0 0 0 0 0 0
Tax benefits from employee stock plans .................................. 0 0 49,478 0 0 49,478 0 49,478
Stock-based expenses ................................................ 0 0 86,570 0 0 86,570 0 86,570
Equity component of the convertible notes issuance, net. ..................... 0 0 124,836 0 0 124,836 0 124,836
Purchase of convertible note hedges ..................................... 0 0 (126,500) 0 0 (126,500) 0 (126,500)
Sale of warrants ..................................................... 0 0 59,283 0 0 59,283 0 59,283
Noncontrolling interest ............................................... 0 0 0 0 0 0 2,161 2,161
Components of comprehensive income, net of tax:
Foreign currency translation adjustment and other ........................ 0 0 0 (2,820) 0 (2,820) 0 (2,820)
Unrealized gain on marketable securities and cash equivalents .............. 0 0 0 4,295 0 4,295 0 4,295
Net income attributable to salesforce.com ............................... 0 0 0 0 80,719 80,719 0 80,719
Total comprehensive income, year ended January 31, 2010 ..................... 0 0 0 0 0 0 0 82,194
Balances at January 31, 2010 .............................................127,152,449 $127 $ 938,544 $ (1,430) $106,561 $1,043,802 $ 12,864 $1,056,666
Exercise of stock options and stock grants to board members for board services . . . 4,697,518 5 165,494 0 0 165,499 0 165,499
Vested restricted stock units converted to shares ........................... 1,071,180 1 0 0 0 1 0 1
Tax benefits from employee stock plans .................................. 0 0 36,069 0 0 36,069 0 36,069
Stock-based expenses ................................................ 0 0 115,139 0 0 115,139 0 115,139
Purchase of subsidiary stock, net ........................................ 0 0 (156,187) 0 0 (156,187) 0 (156,187)
Other ............................................................. 0 0 (455) 0 0 (455) 0 (455)
Noncontrolling interest ............................................... 0 0 0 0 0 0 (12,864) (12,864)
Components of comprehensive income, net of tax:
Foreign currency translation adjustment and other ........................ 0 0 0 5,709 0 5,709 0 5,709
Unrealized gain on marketable securities and cash equivalents and publicly
traded strategic investments ........................................ 0 0 0 2,440 0 2,440 0 2,440
Net income attributable to salesforce.com ............................... 0 0 0 0 64,474 64,474 0 64,474
Total comprehensive income, year ended January 31, 2011 ..................... 0 0 0 0 0 0 0 72,623
Balances at January 31, 2011 .............................................132,921,147 $133 $1,098,604 $ 6,719 $171,035 $1,276,491 $ 0 $1,276,491
Exercise of stock options and stock grants to board members for board services . . . 2,517,431 3 111,779 0 0 111,782 0 111,782
Vested restricted stock units converted to shares ........................... 1,075,001 1 0 0 0 1 0 1
Shares issued related to business combinations ............................. 522,962 0 56,612 56,612 56,612
Tax benefits from employee stock plans .................................. 0 0 1,611 0 0 1,611 0 1,611
Stock-based expenses ................................................ 0 0 225,212 0 0 225,212 0 225,212
Temporary equity reclassification ....................................... 0 0 (78,741) 0 0 (78,741) 0 (78,741)
Components of comprehensive loss, net of tax:
Foreign currency translation adjustment and other ........................ 0 0 0 9,512 0 9,512 0 9,512
Unrealized loss on marketable securities and cash equivalents and publicly
traded strategic investments ........................................ 0 0 0 (3,548) 0 (3,548) 0 (3,548)
Net loss ......................................................... 0 0 0 0 (11,572) (11,572) 0 (11,572)
Total comprehensive loss, year ended January 31, 2012 ........................ 0 0 0 0 0 0 0 (5,608)
Balances at January 31, 2012 .............................................137,036,541 $137 $1,415,077 $12,683 $159,463 $1,587,360 $ 0 $1,587,360
See accompanying Notes.
64