Salesforce.com 2012 Annual Report Download - page 36
Download and view the complete annual report
Please find page 36 of the 2012 Salesforce.com annual report below. You can navigate through the pages in the report by either clicking on the pages listed below, or by using the keyword search tool below to find specific information within the annual report.-
 1
1 -
2
-
3
-
4
-
5
-
6
-
7
-
8
-
9
-
10
-
11
-
12
-
13
-
14
-
15
-
16
-
17
-
18
-
19
-
20
-
21
-
22
-
23
-
24
-
25
-
 26
26 -
 27
27 -
 28
28 -
 29
29 -
 30
30 -
 31
31 -
 32
32 -
 33
33 -
 34
34 -
 35
35 -
 36
36 -
 37
37 -
 38
38 -
 39
39 -
 40
40 -
 41
41 -
 42
42 -
 43
43 -
 44
44 -
 45
45 -
 46
46 -
47
-
48
-
49
-
50
-
51
-
52
-
53
-
54
-
55
-
56
-
57
-
58
-
59
-
60
-
61
-
62
-
63
-
64
-
65
-
66
-
67
-
68
-
69
-
70
-
71
-
72
-
73
-
74
-
75
-
76
-
77
-
78
-
79
-
80
-
81
-
82
-
83
-
84
-
85
-
86
-
87
-
88
-
89
-
90
-
91
-
92
-
93
-
94
-
95
-
96
-
97
-
98
-
99
-
100
-
101
-
102
-
103
-
104
-
105
-
106
-
107
-
108
-
109
-
110
-
111
-
112
-
113
-
114
-
115
-
116
-
117
-
118
-
119
-
120
 |
 |

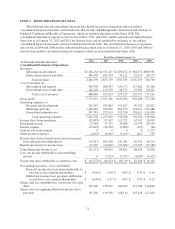
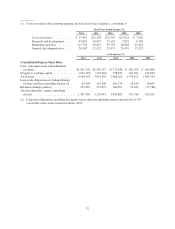
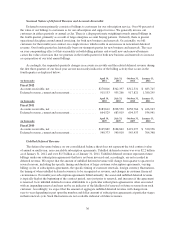
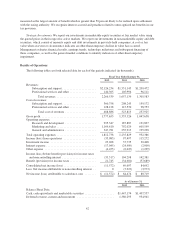
(1) Cost of revenues and operating expenses include stock-based expenses, consisting of:
Fiscal Year Ended January 31,
2012 2011 2010 2009 2008
Cost of revenues ............. $ 17,451 $12,158 $12,570 $11,051 $ 7,926
Research and development ..... 45,894 18,897 13,129 9,852 6,336
Marketing and sales .......... 115,730 56,451 39,722 36,028 25,423
General and administrative .... 50,183 32,923 23,471 20,435 15,522
As of January 31,
2012 2011 2010 2009 2008
Consolidated Balance Sheet Data:
Cash, cash equivalents and marketable
securities .......................... $1,447,174 $1,407,557 $1,727,048 $ 882,565 $ 669,800
(Negative) working capital .............. (651,249) (201,542) 798,029 301,591 134,894
Total assets .......................... 4,164,154 3,091,165 2,460,201 1,479,822 1,089,593
Long-term obligations excluding deferred
revenue and noncontrolling interest (2) . . 85,909 516,506 481,234 20,106 10,601
Retained earnings (deficit) .............. 159,463 171,035 106,561 25,842 (17,586)
Total stockholders’ equity controlling
interest ............................ 1,587,360 1,276,491 1,043,802 671,784 452,059
(2) Long-term obligations excluding deferred revenue and noncontrolling interest includes the 0.75%
convertible senior notes issued in January 2010.
32