Salesforce.com 2012 Annual Report Download - page 46
Download and view the complete annual report
Please find page 46 of the 2012 Salesforce.com annual report below. You can navigate through the pages in the report by either clicking on the pages listed below, or by using the keyword search tool below to find specific information within the annual report.-
 1
1 -
2
-
3
-
4
-
5
-
6
-
7
-
8
-
9
-
10
-
11
-
12
-
13
-
14
-
15
-
16
-
17
-
18
-
19
-
20
-
21
-
22
-
23
-
24
-
25
-
26
-
27
-
28
-
29
-
30
-
31
-
32
-
33
-
34
-
35
-
 36
36 -
 37
37 -
 38
38 -
 39
39 -
 40
40 -
 41
41 -
 42
42 -
 43
43 -
 44
44 -
 45
45 -
 46
46 -
 47
47 -
 48
48 -
 49
49 -
 50
50 -
 51
51 -
 52
52 -
 53
53 -
 54
54 -
 55
55 -
 56
56 -
57
-
58
-
59
-
60
-
61
-
62
-
63
-
64
-
65
-
66
-
67
-
68
-
69
-
70
-
71
-
72
-
73
-
74
-
75
-
76
-
77
-
78
-
79
-
80
-
81
-
82
-
83
-
84
-
85
-
86
-
87
-
88
-
89
-
90
-
91
-
92
-
93
-
94
-
95
-
96
-
97
-
98
-
99
-
100
-
101
-
102
-
103
-
104
-
105
-
106
-
107
-
108
-
109
-
110
-
111
-
112
-
113
-
114
-
115
-
116
-
117
-
118
-
119
-
120
 |
 |

measured as the largest amount of benefit which is greater than 50 percent likely to be realized upon settlement
with the taxing authority. We recognize interest accrued and penalties related to unrecognized tax benefits in our
tax provision.
Strategic Investments. We report our investments in marketable equity securities at fair market value using
the quoted prices in their respective active markets. We report our investments in non-marketable equity and debt
securities, which consist of minority equity and debt investments in privately-held companies, at cost or fair
value when an event or circumstance indicates an other-than-temporary decline in value has occurred.
Management evaluates financial results, earnings trends, technology milestones and subsequent financing of
these companies, as well as the general market conditions to identify indicators of other-than temporary
impairment.
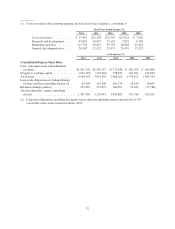
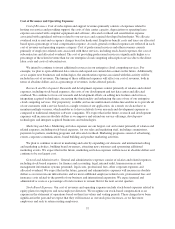
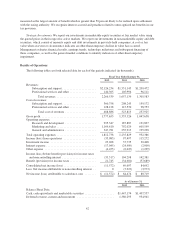
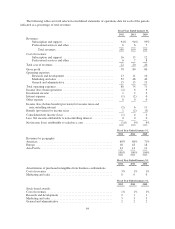
Results of Operations
The following tables set forth selected data for each of the periods indicated (in thousands).
Fiscal Year Ended January 31,
2012 2011 2010
Revenues:
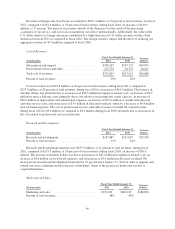
Subscription and support ....................... $2,126,234 $1,551,145 $1,209,472
Professional services and other .................. 140,305 105,994 96,111
Total revenues ........................... 2,266,539 1,657,139 1,305,583
Cost of revenues:
Subscription and support ....................... 360,758 208,243 159,172
Professional services and other .................. 128,128 115,570 98,753
Total cost of revenues ..................... 488,886 323,813 257,925
Gross profit ..................................... 1,777,653 1,333,326 1,047,658
Operating expenses:
Research and development ..................... 295,347 187,887 131,897
Marketing and sales ........................... 1,169,610 792,029 605,199
General and administrative ..................... 347,781 255,913 195,290
Total operating expenses ........................... 1,812,738 1,235,829 932,386
Income (loss) from operations ...................... (35,085) 97,497 115,272
Investment income ............................... 23,268 37,735 30,408
Interest expense .................................. (17,045) (24,909) (2,000)
Other expense ................................... (4,455) (6,025) (1,299)
Income (loss) before benefit (provision) for income taxes
and noncontrolling interest ....................... (33,317) 104,298 142,381
Benefit (provision) for income taxes .................. 21,745 (34,601) (57,689)
Consolidated net income (loss) ...................... (11,572) 69,697 84,692
Less: Net income attributable to noncontrolling interest . . 0 (5,223) (3,973)
Net income (loss) attributable to salesforce.com ........ $ (11,572) $ 64,474 $ 80,719
As of January 31,
2012 2011
Balance Sheet Data:
Cash, cash equivalents and marketable securities .................... $1,447,174 $1,407,557
Deferred revenue, current and noncurrent ......................... 1,380,295 934,941
42