Salesforce.com 2012 Annual Report Download - page 59
Download and view the complete annual report
Please find page 59 of the 2012 Salesforce.com annual report below. You can navigate through the pages in the report by either clicking on the pages listed below, or by using the keyword search tool below to find specific information within the annual report.-
 1
1 -
2
-
3
-
4
-
5
-
6
-
7
-
8
-
9
-
10
-
11
-
12
-
13
-
14
-
15
-
16
-
17
-
18
-
19
-
20
-
21
-
22
-
23
-
24
-
25
-
26
-
27
-
28
-
29
-
30
-
31
-
32
-
33
-
34
-
35
-
36
-
37
-
38
-
39
-
40
-
41
-
42
-
43
-
44
-
45
-
46
-
47
-
48
-
 49
49 -
 50
50 -
 51
51 -
 52
52 -
 53
53 -
 54
54 -
 55
55 -
 56
56 -
 57
57 -
 58
58 -
 59
59 -
 60
60 -
 61
61 -
 62
62 -
 63
63 -
 64
64 -
 65
65 -
 66
66 -
 67
67 -
 68
68 -
 69
69 -
70
-
71
-
72
-
73
-
74
-
75
-
76
-
77
-
78
-
79
-
80
-
81
-
82
-
83
-
84
-
85
-
86
-
87
-
88
-
89
-
90
-
91
-
92
-
93
-
94
-
95
-
96
-
97
-
98
-
99
-
100
-
101
-
102
-
103
-
104
-
105
-
106
-
107
-
108
-
109
-
110
-
111
-
112
-
113
-
114
-
115
-
116
-
117
-
118
-
119
-
120
 |
 |

•Income Tax Effects. The company’s non-GAAP effective tax rate excludes the tax effect of the expense
items described above.
We define non-GAAP gross profit as our total revenues less cost of revenues, as reported on our
consolidated statement of operations, excluding the portions of stock-based expenses and amortization of
purchased intangibles, as described above, that are included in cost of revenues.
We define non-GAAP operating profit as our gross profit less operating expenses, as reported on our
consolidated statement of operations, excluding the portions of stock-based expenses and amortization of
purchased intangibles, as described above, that are included in operating expenses.
Non-GAAP earnings per share
Management uses the non-GAAP earnings per share to provide an additional view of performance by
excluding expenses that are not directly related to performance in any particular period in the earnings per share
calculation.
We define non-GAAP earnings per share as our non-GAAP net income, which excludes the above
components, which we believe are not reflective of our ongoing operational expenses, divided by basic or diluted
shares outstanding.
Limitations on the use of Non-GAAP financial measures
A limitation of our non-GAAP financial measures of non-GAAP gross profit, non-GAAP operating profit,
non-GAAP net income and non-GAAP earnings per share is that they do not have uniform definitions. Our
definitions will likely differ from the definitions used by other companies, including peer companies, and
therefore comparability may be limited. Thus, our non-GAAP measures of non-GAAP gross profit, non-GAAP
operating profit, non-GAAP net income and non-GAAP earnings per share should be considered in addition to,
not as a substitute for, or in isolation from, measures prepared in accordance with GAAP. Additionally, in the
case of stock-based expense, if we did not pay a portion of compensation in the form of stock-based expense, the
cash salary expense included in costs of revenues and operating expenses would be higher which would affect
our cash position.
We compensate for these limitations by reconciling non-GAAP gross profit, non-GAAP operating profit,
non-GAAP net income and non-GAAP earnings per share to the most comparable GAAP financial measure.
Management encourages investors and others to review our financial information in its entirety, not to rely on
any single financial measure and to view our non-GAAP financial measures in conjunction with the most
comparable GAAP financial measures.
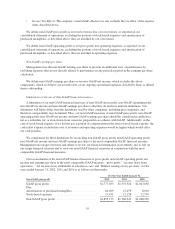
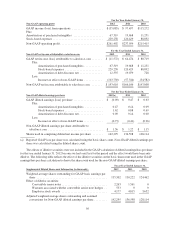
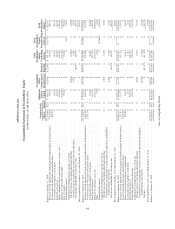
Our reconciliation of the non-GAAP financial measure of gross profit, non-GAAP operating profit, net
income and earnings per share to the most comparable GAAP measure, “gross profit,” “income (loss) from
operations,” “net income (loss) attributable to salesforce.com” and “Diluted earnings (loss) per share” for the
years ended January 31, 2012, 2011 and 2010 is as follows (in thousands):
For the Year Ended January 31,
Non-GAAP gross profit 2012 2011 2010
GAAP gross profit ................................ $1,777,653 $1,333,326 $1,047,658
Plus:
Amortization of purchased intangibles ................ 60,069 15,459 8,010
Stock-based expenses ............................. 17,451 12,158 12,570
Non-GAAP gross profit ........................... $1,855,173 $1,360,943 $1,068,238
55