Rite Aid 2012 Annual Report Download - page 88
Download and view the complete annual report
Please find page 88 of the 2012 Rite Aid annual report below. You can navigate through the pages in the report by either clicking on the pages listed below, or by using the keyword search tool below to find specific information within the annual report.-
 1
1 -
2
-
3
-
4
-
5
-
6
-
7
-
8
-
9
-
10
-
11
-
12
-
13
-
14
-
15
-
16
-
17
-
18
-
19
-
20
-
21
-
22
-
23
-
24
-
25
-
26
-
27
-
28
-
29
-
30
-
31
-
32
-
33
-
34
-
35
-
36
-
37
-
38
-
39
-
40
-
41
-
42
-
43
-
44
-
45
-
46
-
47
-
48
-
49
-
50
-
51
-
52
-
53
-
54
-
55
-
56
-
57
-
58
-
59
-
60
-
61
-
62
-
63
-
64
-
65
-
66
-
67
-
68
-
69
-
70
-
71
-
72
-
73
-
74
-
75
-
76
-
77
-
 78
78 -
 79
79 -
 80
80 -
 81
81 -
 82
82 -
 83
83 -
 84
84 -
 85
85 -
 86
86 -
 87
87 -
 88
88 -
 89
89 -
 90
90 -
 91
91 -
 92
92 -
 93
93 -
 94
94 -
 95
95 -
 96
96 -
 97
97 -
 98
98 -
99
-
100
-
101
-
102
-
103
-
104
-
105
-
106
-
107
-
108
-
109
-
110
-
111
-
112
-
113
-
114
-
115
-
116
-
117
-
118
-
119
-
120
-
121
-
122
-
123
-
124
-
125
-
126
 |
 |

RITE AID CORPORATION AND SUBSIDIARIES
NOTES TO CONSOLIDATED FINANCIAL STATEMENTS (Continued)
For the Years Ended March 3, 2012, February 26, 2011 and February 27, 2010
(In thousands, except per share amounts)
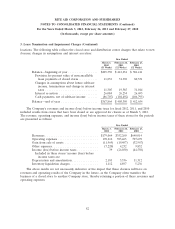
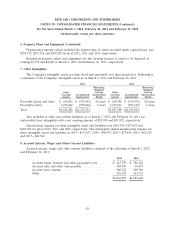
6. Property, Plant and Equipment (Continued)
Depreciation expense, which included the depreciation of assets recorded under capital leases, was
$296,792, $331,928 and $349,282 in fiscal 2012, 2011 and 2010, respectively.
Included in property, plant and equipment was the carrying amount of assets to be disposed of
totaling $2,774 and $4,608 at March 3, 2012 and February 26, 2011, respectively.
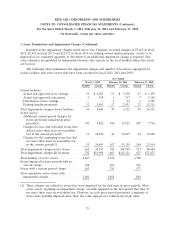
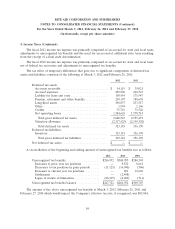
7. Other Intangibles
The Company’s intangible assets are finite-lived and amortized over their useful lives. Following is
a summary of the Company’s intangible assets as of March 3, 2012 and February 26, 2011.
2012 2011
Remaining Remaining
Weighted Weighted
Gross Average Gross Average
Carrying Accumulated Amortization Carrying Accumulated Amortization
Amount Amortization Period Amount Amortization Period
Favorable leases and other . $ 614,862 $ (374,685) 10 years $ 620,786 $ (335,692) 10 years
Prescription files ........ 1,239,444 (950,846) 5 years 1,217,212 (856,129) 6 years
Total ................. $1,854,306 $(1,325,531) $1,837,998 $(1,191,821)
Also included in other non-current liabilities as of March 3, 2012 and February 26, 2011 are
unfavorable lease intangibles with a net carrying amount of $82,030 and $93,952, respectively.
Amortization expense for these intangible assets and liabilities was $143,790, $173,618 and
$184,956 for fiscal 2012, 2011 and 2010, respectively. The anticipated annual amortization expense for
these intangible assets and liabilities is 2013—$115,817; 2014—$90,539; 2015—$73,650; 2016—$62,328
and 2017—$49,382.
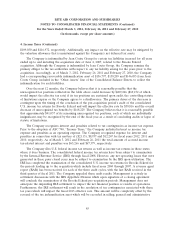
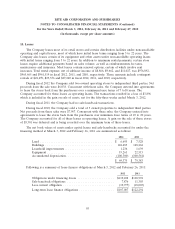
8. Accrued Salaries, Wages and Other Current Liabilities
Accrued salaries, wages and other current liabilities consisted of the following at March 3, 2012
and February 26, 2011:
2012 2011
Accrued wages, benefits and other personnel costs ....... $ 415,539 $ 386,226
Accrued sales and other taxes payable ................ 103,596 98,433
Accrued store expense ........................... 200,222 200,786
Other ....................................... 345,150 363,961
$1,064,507 $1,049,406
88