Rite Aid 2012 Annual Report Download - page 31
Download and view the complete annual report
Please find page 31 of the 2012 Rite Aid annual report below. You can navigate through the pages in the report by either clicking on the pages listed below, or by using the keyword search tool below to find specific information within the annual report.-
 1
1 -
2
-
3
-
4
-
5
-
6
-
7
-
8
-
9
-
10
-
11
-
12
-
13
-
14
-
15
-
16
-
17
-
18
-
19
-
20
-
 21
21 -
 22
22 -
 23
23 -
 24
24 -
 25
25 -
 26
26 -
 27
27 -
 28
28 -
 29
29 -
 30
30 -
 31
31 -
 32
32 -
 33
33 -
 34
34 -
 35
35 -
 36
36 -
 37
37 -
 38
38 -
 39
39 -
 40
40 -
 41
41 -
42
-
43
-
44
-
45
-
46
-
47
-
48
-
49
-
50
-
51
-
52
-
53
-
54
-
55
-
56
-
57
-
58
-
59
-
60
-
61
-
62
-
63
-
64
-
65
-
66
-
67
-
68
-
69
-
70
-
71
-
72
-
73
-
74
-
75
-
76
-
77
-
78
-
79
-
80
-
81
-
82
-
83
-
84
-
85
-
86
-
87
-
88
-
89
-
90
-
91
-
92
-
93
-
94
-
95
-
96
-
97
-
98
-
99
-
100
-
101
-
102
-
103
-
104
-
105
-
106
-
107
-
108
-
109
-
110
-
111
-
112
-
113
-
114
-
115
-
116
-
117
-
118
-
119
-
120
-
121
-
122
-
123
-
124
-
125
-
126
 |
 |
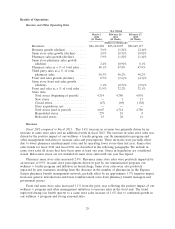
Pharmacy gross margin was lower due to a higher LIFO charge and continued reimburse rate pressure
partially offset by new generic introductions.
Gross profit decreased for fiscal 2011 compared to fiscal 2010 due to lower same store sales and
higher wellness + loyalty program revenue deferrals. Gross margin was 26.5% for fiscal 2011 compared
to 26.6% in fiscal 2010. The decline in gross margin was due primarily to deferred revenue related to
our wellness + customer loyalty program and a slight reduction in pharmacy gross margin, partially
offset by lower product costs and new generic introductions. There was a negative impact from the
reductions in Medicare reimbursements resulting from the AWP rollback which was fully cycled in
September 2010. The pharmacy margin pressure slowed as we continued to cycle the more significant
maximum allowable costs (‘‘MAC’’) of new generics which occurred last year. Front-end gross margin
was lower due primarily to an increase in deferred revenue related to our wellness + customer loyalty
program and related discounts. Partially offsetting the lower gross margin discussed above was a
reduction in LIFO and inventory cost capitalization charges.
We use the last-in, first-out (LIFO) method of inventory valuation, which is determined annually
when inflation rates and inventory levels are finalized. Therefore, LIFO costs for interim period
financial statements are estimated. The LIFO charge was $188.7 million in fiscal 2012, $44.9 million in
fiscal 2011, and $88.5 million in fiscal 2010. The increase in the LIFO charge in fiscal 2012 is due to
higher inflation on both pharmacy and front end products. The pharmacy inflation rate in fiscal 2012
was 6.6% higher than the prior year and front-end inflation was over 1.7% higher than the prior year.
Selling, General and Administrative Expenses
SG&A expenses increased by $73.6 million in fiscal 2012 compared to fiscal 2011 due mostly to
expenses associated with the fifty-third week in fiscal 2012. SG&A as a percentage of revenue improved
over fiscal 2011 due to leveraging our fixed costs relative to revenue growth. SG&A for fiscal 2012 was
25.0% as a percentage of revenue, compared to 25.6% in fiscal 2011. The decrease in SG&A as a
percentage of revenues is mostly due to a decrease in salaries and benefits resulting from continued
labor control initiatives, lower occupancy and lower depreciation and amortization, and other cost
containment initiatives. These favorable variances were partially offset by an increase in bonus expense
relating to improved results and higher workers’ compensation costs associated with unfavorable
discount rate changes.
SG&A for fiscal 2011 was 25.6% as a percentage of revenue, compared to 25.7% in fiscal 2010.
The decrease in SG&A as a percentage of revenues is mostly due to a decrease in salaries and benefit
costs due to better labor control and reductions in store operating expenses and corporate
administrative expenses resulting from our various cost reduction initiatives. Additionally, we incurred
no securitization fees due to our elimination of the receivables securitization facilities on October 26,
2009. These cost reductions were partially offset by an increase in debit and credit card fees, and
higher workers’ compensation and general liability costs due to a reserve reduction caused by favorable
claims experience recorded in the prior year.
Lease Termination and Impairment Charges
Impairment Charges:
We evaluate long-lived assets for impairment whenever events or changes in circumstances indicate
that an asset group has a carrying value that may not be recoverable. The individual operating store is
the lowest level for which cash flows are identifiable. As such, we evaluate individual stores for
recoverability. To determine if a store needs to be tested for recoverability, we consider items such as
decreases in market prices, changes in the manner in which the store is being used or physical
condition, changes in legal factors or business climate, an accumulation of losses significantly in excess
31