Rite Aid 2012 Annual Report Download - page 100
Download and view the complete annual report
Please find page 100 of the 2012 Rite Aid annual report below. You can navigate through the pages in the report by either clicking on the pages listed below, or by using the keyword search tool below to find specific information within the annual report.-
 1
1 -
2
-
3
-
4
-
5
-
6
-
7
-
8
-
9
-
10
-
11
-
12
-
13
-
14
-
15
-
16
-
17
-
18
-
19
-
20
-
21
-
22
-
23
-
24
-
25
-
26
-
27
-
28
-
29
-
30
-
31
-
32
-
33
-
34
-
35
-
36
-
37
-
38
-
39
-
40
-
41
-
42
-
43
-
44
-
45
-
46
-
47
-
48
-
49
-
50
-
51
-
52
-
53
-
54
-
55
-
56
-
57
-
58
-
59
-
60
-
61
-
62
-
63
-
64
-
65
-
66
-
67
-
68
-
69
-
70
-
71
-
72
-
73
-
74
-
75
-
76
-
77
-
78
-
79
-
80
-
81
-
82
-
83
-
84
-
85
-
86
-
87
-
88
-
89
-
 90
90 -
 91
91 -
 92
92 -
 93
93 -
 94
94 -
 95
95 -
 96
96 -
 97
97 -
 98
98 -
 99
99 -
 100
100 -
 101
101 -
 102
102 -
 103
103 -
 104
104 -
 105
105 -
 106
106 -
 107
107 -
 108
108 -
 109
109 -
 110
110 -
111
-
112
-
113
-
114
-
115
-
116
-
117
-
118
-
119
-
120
-
121
-
122
-
123
-
124
-
125
-
126
 |
 |

RITE AID CORPORATION AND SUBSIDIARIES
NOTES TO CONSOLIDATED FINANCIAL STATEMENTS (Continued)
For the Years Ended March 3, 2012, February 26, 2011 and February 27, 2010
(In thousands, except per share amounts)
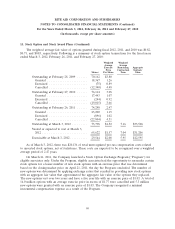
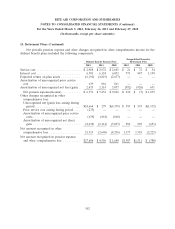
13. Stock Option and Stock Award Plans (Continued)
Cash received from stock option exercises for fiscal 2012, 2011, and 2010 was $914, $226, and $66
respectively. There was no income tax benefit from stock options for fiscal 2012, 2011 and 2010. The
total intrinsic value of stock options exercised for fiscal 2012, 2011, and 2010 was $255, $81, and $44,
respectively.
Typically, stock options granted vest, and are subsequently exercisable in equal annual installments
over a four-year period for employees. During fiscal 2012, certain employee stock options and awards
were issued that vest 50% in year 3 and 50% in year four. Non-employee director options granted vest,
and are subsequently exercisable in equal annual installments over a three-year period. Stock awards
granted vest in equal annual installments over a three-year period. Beginning in fiscal 2011, stock
awards granted to non-employee directors vest 80% in year one, 10% in year two and 10% in year
three.
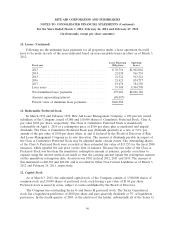
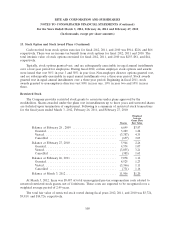
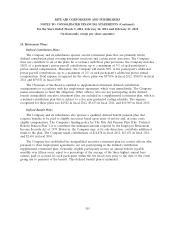
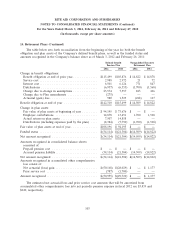
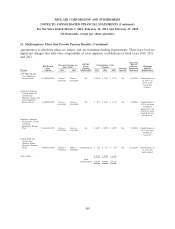
Restricted Stock
The Company provides restricted stock grants to associates under plans approved by the
stockholders. Shares awarded under the plans vest in installments up to three years and unvested shares
are forfeited upon termination of employment. Following is a summary of restricted stock transactions
for the fiscal years ended March 3, 2012, February 26, 2011, and February 27, 2010:
Weighted
Average
Grant Date
Shares Fair Value
Balance at February 28 , 2009 ......................... 6,699 $3.87
Granted ........................................ 3,289 1.28
Vested ......................................... (3,387) 4.35
Cancelled ...................................... (657) 3.03
Balance at February 27, 2010 .......................... 5,944 2.26
Granted ........................................ 4,574 1.07
Vested ......................................... (3,055) 3.21
Cancelled ...................................... (385) 1.65
Balance at February 26, 2011 .......................... 7,078 1.12
Granted ........................................ 8,525 1.23
Vested ......................................... (3,366) 1.11
Cancelled ...................................... (731) 1.16
Balance at March 3, 2012 ............................. 11,506 $1.20
At March 3, 2012, there was $9,487 of total unrecognized pre-tax compensation costs related to
unvested restricted stock grants, net of forfeitures. These costs are expected to be recognized over a
weighted average period of 2.49 years.
The total fair value of restricted stock vested during fiscal years 2012, 2011, and 2010 was $3,724,
$9,819, and $14,726, respectively.
100