Rite Aid 2012 Annual Report Download - page 45
Download and view the complete annual report
Please find page 45 of the 2012 Rite Aid annual report below. You can navigate through the pages in the report by either clicking on the pages listed below, or by using the keyword search tool below to find specific information within the annual report.-
 1
1 -
2
-
3
-
4
-
5
-
6
-
7
-
8
-
9
-
10
-
11
-
12
-
13
-
14
-
15
-
16
-
17
-
18
-
19
-
20
-
21
-
22
-
23
-
24
-
25
-
26
-
27
-
28
-
29
-
30
-
31
-
32
-
33
-
34
-
 35
35 -
 36
36 -
 37
37 -
 38
38 -
 39
39 -
 40
40 -
 41
41 -
 42
42 -
 43
43 -
 44
44 -
 45
45 -
 46
46 -
 47
47 -
 48
48 -
 49
49 -
 50
50 -
 51
51 -
 52
52 -
 53
53 -
 54
54 -
 55
55 -
56
-
57
-
58
-
59
-
60
-
61
-
62
-
63
-
64
-
65
-
66
-
67
-
68
-
69
-
70
-
71
-
72
-
73
-
74
-
75
-
76
-
77
-
78
-
79
-
80
-
81
-
82
-
83
-
84
-
85
-
86
-
87
-
88
-
89
-
90
-
91
-
92
-
93
-
94
-
95
-
96
-
97
-
98
-
99
-
100
-
101
-
102
-
103
-
104
-
105
-
106
-
107
-
108
-
109
-
110
-
111
-
112
-
113
-
114
-
115
-
116
-
117
-
118
-
119
-
120
-
121
-
122
-
123
-
124
-
125
-
126
 |
 |

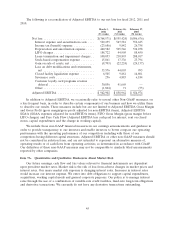
The following is a reconciliation of Adjusted EBITDA to our net loss for fiscal 2012, 2011 and
2010:
March 3, February 26, February 27,
2012 2011 2010
(53 weeks) (52 weeks) (52 weeks)
Net loss ............................. $(368,571) $(555,424) $(506,676)
Interest expense and securitization costs .... 529,255 547,581 552,625
Income tax (benefit) expense ............ (23,686) 9,842 26,758
Depreciation and amortization expense ..... 440,582 505,546 534,238
LIFO charges ....................... 188,722 44,905 88,450
Lease termination and impairment charges . . 100,053 210,893 208,017
Stock-based compensation expense ........ 15,861 17,336 23,794
Gain on sale of assets, net .............. (8,703) (22,224) (24,137)
Loss on debt modifications and retirements,
net ............................. 33,576 44,003 993
Closed facility liquidation expense ........ 6,505 9,881 14,801
Severance costs ...................... 256 4,883 6,184
Customer loyalty card programs revenue
deferral .......................... 30,856 41,669 —
Other ............................. (1,804) 71 (73)
Adjusted EBITDA ..................... $942,902 $ 858,962 $ 924,974
In addition to Adjusted EBITDA, we occasionally refer to several other Non-GAAP measures, on
a less frequent basis, in order to describe certain components of our business and how we utilize them
to describe our results. These measures include but are not limited to Adjusted EBITDA Gross Margin
and Gross Profit (gross margin/gross profit adjusted for non-EBITDA items), Adjusted EBITDA
SG&A (SG&A expenses adjusted for non-EBITDA items), FIFO Gross Margin (gross margin before
LIFO charges) and Free Cash Flow (Adjusted EBITDA less cash paid for interest, rent on closed
stores, capital expenditures and the change in working capital).
We include these non-GAAP financial measures in our earnings announcements and guidance in
order to provide transparency to our investors and enable investors to better compare our operating
performance with the operating performance of our competitors including with those of our
competitors having different capital structures. Adjusted EBITDA or other non-GAAP measures should
not be considered in isolation from, and are not intended to represent an alternative measure of,
operating results or of cash flows from operating activities, as determined in accordance with GAAP.
Our definition of these non-GAAP measures may not be comparable to similarly titled measurements
reported by other companies.
Item 7A. Quantitative and Qualitative Disclosures About Market Risk
Our future earnings, cash flow and fair values relevant to financial instruments are dependent
upon prevalent market rates. Market risk is the risk of loss from adverse changes in market prices and
interest rates. Our major market risk exposure is changing interest rates. Increases in interest rates
would increase our interest expense. We enter into debt obligations to support capital expenditures,
acquisitions, working capital needs and general corporate purposes. Our policy is to manage interest
rates through the use of a combination of variable-rate credit facilities, fixed-rate long-term obligations
and derivative transactions. We currently do not have any derivative transactions outstanding.
45