Rite Aid 2012 Annual Report Download - page 68
Download and view the complete annual report
Please find page 68 of the 2012 Rite Aid annual report below. You can navigate through the pages in the report by either clicking on the pages listed below, or by using the keyword search tool below to find specific information within the annual report.-
 1
1 -
2
-
3
-
4
-
5
-
6
-
7
-
8
-
9
-
10
-
11
-
12
-
13
-
14
-
15
-
16
-
17
-
18
-
19
-
20
-
21
-
22
-
23
-
24
-
25
-
26
-
27
-
28
-
29
-
30
-
31
-
32
-
33
-
34
-
35
-
36
-
37
-
38
-
39
-
40
-
41
-
42
-
43
-
44
-
45
-
46
-
47
-
48
-
49
-
50
-
51
-
52
-
53
-
54
-
55
-
56
-
57
-
 58
58 -
 59
59 -
 60
60 -
 61
61 -
 62
62 -
 63
63 -
 64
64 -
 65
65 -
 66
66 -
 67
67 -
 68
68 -
 69
69 -
 70
70 -
 71
71 -
 72
72 -
 73
73 -
 74
74 -
 75
75 -
 76
76 -
 77
77 -
 78
78 -
79
-
80
-
81
-
82
-
83
-
84
-
85
-
86
-
87
-
88
-
89
-
90
-
91
-
92
-
93
-
94
-
95
-
96
-
97
-
98
-
99
-
100
-
101
-
102
-
103
-
104
-
105
-
106
-
107
-
108
-
109
-
110
-
111
-
112
-
113
-
114
-
115
-
116
-
117
-
118
-
119
-
120
-
121
-
122
-
123
-
124
-
125
-
126
 |
 |

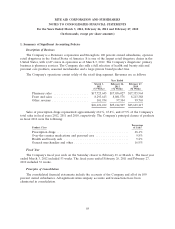
RITE AID CORPORATION AND SUBSIDIARIES
NOTES TO CONSOLIDATED FINANCIAL STATEMENTS
For the Years Ended March 3, 2012, February 26, 2011 and February 27, 2010
(In thousands, except per share amounts)
1. Summary of Significant Accounting Policies
Description of Business
The Company is a Delaware corporation and through its 100 percent owned subsidiaries, operates
retail drugstores in the United States of America. It is one of the largest retail drugstore chains in the
United States, with 4,667 stores in operation as of March 3, 2012. The Company’s drugstores’ primary
business is pharmacy services. The Company also sells a full selection of health and beauty aids and
personal care products, seasonal merchandise and a large private brand product line.
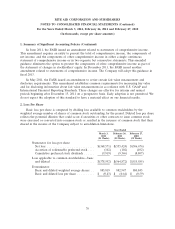
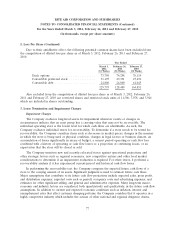
The Company’s operations consist solely of the retail drug segment. Revenues are as follows:
Year Ended
March 3, February 26, February 27,
2012 2011 2010
(53 Weeks) (52 Weeks) (52 Weeks)
Pharmacy sales .................... $17,725,645 $17,036,027 $17,355,964
Front end sales .................... 8,293,643 8,081,576 8,213,388
Other revenue ..................... 101,934 97,304 99,765
$26,121,222 $25,214,907 $25,669,117
Sales of prescription drugs represented approximately 68.1%, 67.8%, and 67.9% of the Company’s
total sales in fiscal years 2012, 2011 and 2010, respectively. The Company’s principal classes of products
in fiscal 2012 were the following:
Percentage
Product Class of Sales
Prescription drugs ......................................... 68.1%
Over-the-counter medications and personal care ................... 9.8%
Health and beauty aids ..................................... 5.2%
General merchandise and other ............................... 16.9%
Fiscal Year
The Company’s fiscal year ends on the Saturday closest to February 29 or March 1. The fiscal year
ended March 3, 2012 included 53 weeks. The fiscal years ended February 26, 2011 and February 27,
2010 included 52 weeks.
Principles of Consolidation
The consolidated financial statements include the accounts of the Company and all of its 100
percent owned subsidiaries. All significant intercompany accounts and transactions have been
eliminated in consolidation.
68