Rite Aid 2012 Annual Report Download - page 80
Download and view the complete annual report
Please find page 80 of the 2012 Rite Aid annual report below. You can navigate through the pages in the report by either clicking on the pages listed below, or by using the keyword search tool below to find specific information within the annual report.-
 1
1 -
2
-
3
-
4
-
5
-
6
-
7
-
8
-
9
-
10
-
11
-
12
-
13
-
14
-
15
-
16
-
17
-
18
-
19
-
20
-
21
-
22
-
23
-
24
-
25
-
26
-
27
-
28
-
29
-
30
-
31
-
32
-
33
-
34
-
35
-
36
-
37
-
38
-
39
-
40
-
41
-
42
-
43
-
44
-
45
-
46
-
47
-
48
-
49
-
50
-
51
-
52
-
53
-
54
-
55
-
56
-
57
-
58
-
59
-
60
-
61
-
62
-
63
-
64
-
65
-
66
-
67
-
68
-
69
-
 70
70 -
 71
71 -
 72
72 -
 73
73 -
 74
74 -
 75
75 -
 76
76 -
 77
77 -
 78
78 -
 79
79 -
 80
80 -
 81
81 -
 82
82 -
 83
83 -
 84
84 -
 85
85 -
 86
86 -
 87
87 -
 88
88 -
 89
89 -
 90
90 -
91
-
92
-
93
-
94
-
95
-
96
-
97
-
98
-
99
-
100
-
101
-
102
-
103
-
104
-
105
-
106
-
107
-
108
-
109
-
110
-
111
-
112
-
113
-
114
-
115
-
116
-
117
-
118
-
119
-
120
-
121
-
122
-
123
-
124
-
125
-
126
 |
 |
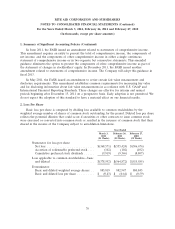
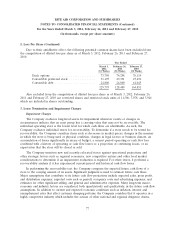
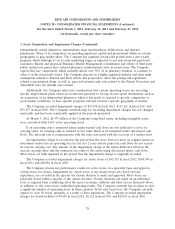
RITE AID CORPORATION AND SUBSIDIARIES
NOTES TO CONSOLIDATED FINANCIAL STATEMENTS (Continued)
For the Years Ended March 3, 2012, February 26, 2011 and February 27, 2010
(In thousands, except per share amounts)
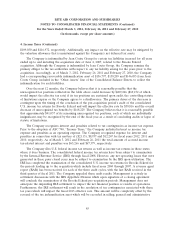
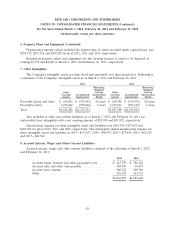
3. Lease Termination and Impairment Charges (Continued)
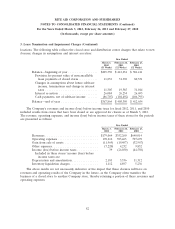
Accordingly, these stores may be further impaired in the current and future periods as a result of
changes in their actual or projected cash flows, or changes to their fair value estimates. Also, the
Company makes ongoing capital additions to certain stores to improve their operating results or to
meet geographical competition, which if later are deemed to be unrecoverable, will be impaired in
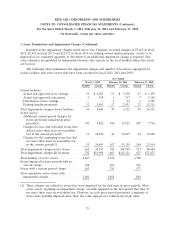
future periods. Of this total, 583, 577 and 431 stores for fiscal years 2012, 2011 and 2010
respectively have been fully impaired.
(2) These charges are related to new stores (open at least 3 years) and relocated stores (relocated in
the last 2 years) that did not meet their recoverability test during the current period. These stores
have not met their original return on investment projections and have a historical loss of at least
2 years. Their future cash flow projections do not recover their current carrying value. Of this
total, 19, 43 and 30 stores for fiscal years 2012, 2011 and 2010 respectively have been fully
impaired.
(3) These charges are related to the remaining active stores that did not meet the recoverability test
during the current period. These stores have a historical loss of at least 2 years. Their future cash
flow projections do not recover their current carrying value. Of this total, 43, 141 and 92 stores for
fiscal years 2012, 2011 and 2010 respectively have been fully impaired.
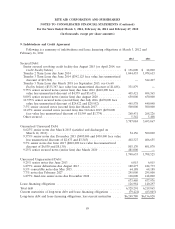
The primary drivers of its impairment charges are each store’s current and historical operating
performance and the assumptions that the Company makes about each store’s operating performance
in future periods. Projected cash flows are updated based on the next year’s operating budget which
includes the qualitative factors noted above. The Company is unable to predict with any degree of
certainty which individual stores will fall short or exceed future operating plans. Accordingly, the
Company is unable to describe future trends that would affect its impairment charges, including the
likely stores and their related asset values that may fail their recoverability test in future periods.
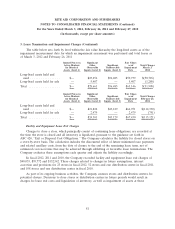
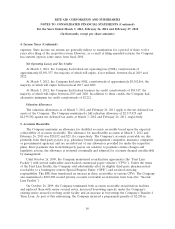
The Company prioritizes inputs used in measuring the fair value of its nonfinancial assets and
liabilities into a hierarchy of three levels: Level 1—quoted prices (unadjusted) in active markets for
identical assets or liabilities; Level 2—inputs other than quoted prices included within Level 1 that are
either directly or indirectly observable; and Level 3—unobservable inputs in which little or no market
activity exists, therefore requiring an entity to develop its own assumptions about the assumptions that
market participants would use in pricing.
Long-lived assets are measured at fair value on a nonrecurring basis for purposes of calculating
impairment using Level 2 and Level 3 inputs as defined in the fair value hierarchy. The fair value of
long-lived assets using Level 2 inputs is determined by evaluating the current economic conditions in
the geographic area for similar use assets. The fair value of long-lived assets using Level 3 inputs is
determined by estimating the amount and timing of net future cash flows and discounting them using a
risk-adjusted rate of interest. The Company estimates future cash flows based on its experience and
knowledge of the market in which the store is located.
80