Rite Aid 2012 Annual Report Download - page 33
Download and view the complete annual report
Please find page 33 of the 2012 Rite Aid annual report below. You can navigate through the pages in the report by either clicking on the pages listed below, or by using the keyword search tool below to find specific information within the annual report.-
 1
1 -
2
-
3
-
4
-
5
-
6
-
7
-
8
-
9
-
10
-
11
-
12
-
13
-
14
-
15
-
16
-
17
-
18
-
19
-
20
-
21
-
22
-
 23
23 -
 24
24 -
 25
25 -
 26
26 -
 27
27 -
 28
28 -
 29
29 -
 30
30 -
 31
31 -
 32
32 -
 33
33 -
 34
34 -
 35
35 -
 36
36 -
 37
37 -
 38
38 -
 39
39 -
 40
40 -
 41
41 -
 42
42 -
 43
43 -
44
-
45
-
46
-
47
-
48
-
49
-
50
-
51
-
52
-
53
-
54
-
55
-
56
-
57
-
58
-
59
-
60
-
61
-
62
-
63
-
64
-
65
-
66
-
67
-
68
-
69
-
70
-
71
-
72
-
73
-
74
-
75
-
76
-
77
-
78
-
79
-
80
-
81
-
82
-
83
-
84
-
85
-
86
-
87
-
88
-
89
-
90
-
91
-
92
-
93
-
94
-
95
-
96
-
97
-
98
-
99
-
100
-
101
-
102
-
103
-
104
-
105
-
106
-
107
-
108
-
109
-
110
-
111
-
112
-
113
-
114
-
115
-
116
-
117
-
118
-
119
-
120
-
121
-
122
-
123
-
124
-
125
-
126
 |
 |

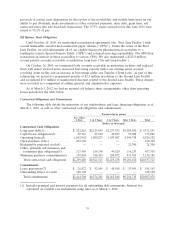
We review key performance results for active stores on a quarterly basis and approve certain stores
for closure. Impairment for closed stores, if any (many stores are closed on lease expiration), are
recorded in the quarter the closure decision is made and approved. Most stores are physically closed
within a quarter of the closure decision. Closure decisions are made on an individual store or regional
basis considering all of the macro-economic, industry and other factors discussed above, in addition to,
the operating store’s individual operating results. We currently have no plans to close a significant
number of active stores in future periods. In the next fiscal year, we currently expect to close 50 stores,
primarily as a result of lease expirations. We recorded impairment charges for closed facilities of $8.6
million in fiscal 2012, $6.1 million in fiscal 2011 and $26.6 million in fiscal 2010.
Included in the impairment charges noted above were charges of $5.9 million in fiscal 2012, $2.4
million in fiscal 2011 and $12.3 million in fiscal 2010 for existing owned surplus property. Assets to be
disposed of are evaluated quarterly to determine if an additional impairment charge is required. Fair
value estimates are provided by independent brokers who operate in the local markets where the assets
are located.
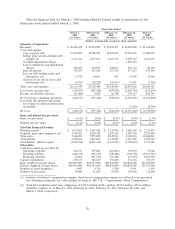
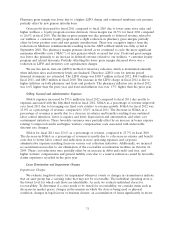
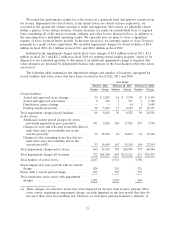
The following table summarizes the impairment charges and number of locations, segregated by
closed facilities and active stores that have been recorded in fiscal 2012, 2011 and 2010:
Year Ended
March 3, 2012 February 26, 2011 February 27, 2010
Number Charge Number Charge Number Charge
Closed facilities:
Actual and approved store closings ........... 55 $ 2,283 51 $ 3,278 67 $ 5,479
Actual and approved relocations ............. 2 499 1 317 7 3,108
Distribution center closings ................. — — 1 94 1 5,689
Existing surplus properties ................. 12 5,863 17 2,433 23 12,315
Total impairment charges-closed facilities ........ 69 8,645 70 6,122 98 26,591
Active stores:
Additional current period charges for stores
previously impaired in prior periods(1) ....... 591 9,822 584 17,825 437 7,710
Charges for new and relocated stores that did not
meet their asset recoverability test in the
current period(2) ...................... 19 18,926 44 36,015 32 17,260
Charges for the remaining stores that did not
meet their asset recoverability test in the
current period(3) ...................... 53 14,605 167 55,159 104 23,914
Total impairment charges-active stores .......... 663 43,353 795 108,999 573 48,884
Total impairment charges-all locations ........... 732 $51,998 865 $115,121 671 $75,475
Total number of active stores ................. 4,667 4,714 4,780
Stores impaired in prior periods with no current
charge ................................ 428 263 321
Stores with a current period charge ............ 663 795 573
Total cumulative active stores with impairment
charges ............................... 1,091 1,058 894
(1) These charges are related to stores that were impaired for the first time in prior periods. Most
active stores, requiring an impairment charge, are fully impaired in the first period that they do
not meet their asset recoverability test. However, in each prior period presented, a minority of
33