Rite Aid 2012 Annual Report Download - page 30
Download and view the complete annual report
Please find page 30 of the 2012 Rite Aid annual report below. You can navigate through the pages in the report by either clicking on the pages listed below, or by using the keyword search tool below to find specific information within the annual report.-
 1
1 -
2
-
3
-
4
-
5
-
6
-
7
-
8
-
9
-
10
-
11
-
12
-
13
-
14
-
15
-
16
-
17
-
18
-
19
-
 20
20 -
 21
21 -
 22
22 -
 23
23 -
 24
24 -
 25
25 -
 26
26 -
 27
27 -
 28
28 -
 29
29 -
 30
30 -
 31
31 -
 32
32 -
 33
33 -
 34
34 -
 35
35 -
 36
36 -
 37
37 -
 38
38 -
 39
39 -
 40
40 -
41
-
42
-
43
-
44
-
45
-
46
-
47
-
48
-
49
-
50
-
51
-
52
-
53
-
54
-
55
-
56
-
57
-
58
-
59
-
60
-
61
-
62
-
63
-
64
-
65
-
66
-
67
-
68
-
69
-
70
-
71
-
72
-
73
-
74
-
75
-
76
-
77
-
78
-
79
-
80
-
81
-
82
-
83
-
84
-
85
-
86
-
87
-
88
-
89
-
90
-
91
-
92
-
93
-
94
-
95
-
96
-
97
-
98
-
99
-
100
-
101
-
102
-
103
-
104
-
105
-
106
-
107
-
108
-
109
-
110
-
111
-
112
-
113
-
114
-
115
-
116
-
117
-
118
-
119
-
120
-
121
-
122
-
123
-
124
-
125
-
126
 |
 |

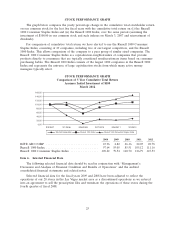
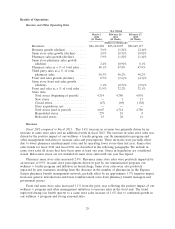
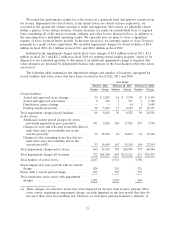
Fiscal 2011 compared to Fiscal 2010: The 1.8% decline in revenue was primarily driven by a
reduction in our store base and a decline in same store sales, which decreased 0.7% compared to prior
year. This decline consisted of 0.9% pharmacy same store sales decrease and a 0.3% decrease in front
end same store sales. Additionally, revenues decreased 0.2% compared to the prior year due to revenue
deferrals related to our wellness + loyalty program.
Pharmacy same store sales decreased 0.9%. Same store prescriptions decreased 1.2%. The decline
in same store prescriptions was impacted by a slower start and overall softer cough, cold and flu
season, coupled with an increase in 90-day prescriptions compared to last year. Same store sales were
negatively impacted by lower reimbursement rates, increased generic penetration and the prescription
decline. These trends improved during our fourth quarter as the cough, cold and flu season intensified
contributing to same store pharmacy sales increased 0.8%.
Front end same store sales decreased 0.3% from the prior year due to weakness in the overall
economic environment and its impact on consumer spending behavior, partially offset by various
management initiatives, such as our wellness + loyalty card program. The trend improved during our
fourth quarter due largely to the later cough, cold and flu season and our wellness + loyalty card
program, which resulted in a front-end same store sales increase of 1.0% compared to the fourth
quarter last year.
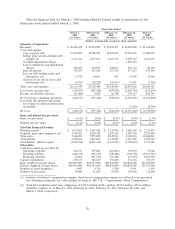
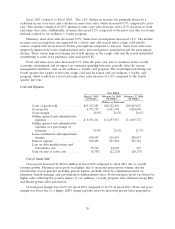
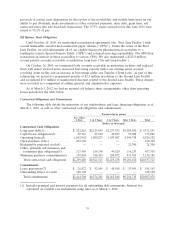
Costs and Expenses
Year Ended
March 3, 2012 February 26, 2011 February 27, 2010
(53 Weeks) (52 Weeks) (52 Weeks)
(Dollars in thousands)
Costs of goods sold ............. $19,327,887 $18,522,403 $18,845,027
Gross profit .................. 6,793,335 6,692,504 6,824,090
Gross margin ................. 26.0% 26.5% 26.6%
Selling, general and administrative
expenses ................... $ 6,531,411 $ 6,457,833 $ 6,603,372
Selling, general and administrative
expenses as a percentage of
revenues ................... 25.0% 25.6% 25.7%
Lease termination and impairment
charges .................... 100,053 210,893 208,017
Interest expense ............... 529,255 547,581 515,763
Loss on debt modifications and
retirements, net .............. 33,576 44,003 993
Gain on sale of assets, net ........ (8,703) (22,224) (24,137)
Cost of Goods Sold
Gross profit increased by $100.8 million in fiscal 2012 compared to fiscal 2011 due to overall
revenue growth. Pharmacy gross profit was higher due to increased prescription volume and the
introduction of new generics including generic Lipitor, partially offset by continued pressure on
pharmacy benefit manager and governmental reimbursement rates. Front-end gross profit was driven by
higher sales reflecting the positive impact of our wellness + loyalty program and continued strong Rite
Aid Brand private label penetration.
Overall gross margin was 26.0% for fiscal 2012 compared to 26.5% in fiscal 2011. Front end gross
margin was lower due to a higher LIFO charge partially offset by increased private label penetration.
30