Rite Aid 2012 Annual Report Download - page 64
Download and view the complete annual report
Please find page 64 of the 2012 Rite Aid annual report below. You can navigate through the pages in the report by either clicking on the pages listed below, or by using the keyword search tool below to find specific information within the annual report.-
 1
1 -
2
-
3
-
4
-
5
-
6
-
7
-
8
-
9
-
10
-
11
-
12
-
13
-
14
-
15
-
16
-
17
-
18
-
19
-
20
-
21
-
22
-
23
-
24
-
25
-
26
-
27
-
28
-
29
-
30
-
31
-
32
-
33
-
34
-
35
-
36
-
37
-
38
-
39
-
40
-
41
-
42
-
43
-
44
-
45
-
46
-
47
-
48
-
49
-
50
-
51
-
52
-
53
-
 54
54 -
 55
55 -
 56
56 -
 57
57 -
 58
58 -
 59
59 -
 60
60 -
 61
61 -
 62
62 -
 63
63 -
 64
64 -
 65
65 -
 66
66 -
 67
67 -
 68
68 -
 69
69 -
 70
70 -
 71
71 -
 72
72 -
 73
73 -
 74
74 -
75
-
76
-
77
-
78
-
79
-
80
-
81
-
82
-
83
-
84
-
85
-
86
-
87
-
88
-
89
-
90
-
91
-
92
-
93
-
94
-
95
-
96
-
97
-
98
-
99
-
100
-
101
-
102
-
103
-
104
-
105
-
106
-
107
-
108
-
109
-
110
-
111
-
112
-
113
-
114
-
115
-
116
-
117
-
118
-
119
-
120
-
121
-
122
-
123
-
124
-
125
-
126
 |
 |

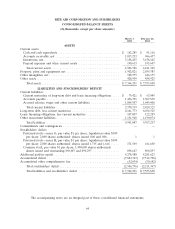
RITE AID CORPORATION AND SUBSIDIARIES
CONSOLIDATED BALANCE SHEETS
(In thousands, except per share amounts)
March 3, February 26,
2012 2011
ASSETS
Current assets:
Cash and cash equivalents ................................... $ 162,285 $ 91,116
Accounts receivable, net .................................... 1,013,233 966,457
Inventories, net ........................................... 3,138,455 3,158,145
Prepaid expenses and other current assets ....................... 190,613 195,647
Total current assets ...................................... 4,504,586 4,411,365
Property, plant and equipment, net .............................. 1,902,021 2,039,383
Other intangibles, net ........................................ 528,775 646,177
Other assets ............................................... 428,909 458,925
Total assets ............................................ $7,364,291 $ 7,555,850
LIABILITIES AND STOCKHOLDERS’ DEFICIT
Current liabilities:
Current maturities of long-term debt and lease financing obligations .... $ 79,421 $ 63,045
Accounts payable ......................................... 1,426,391 1,307,872
Accrued salaries, wages and other current liabilities ................ 1,064,507 1,049,406
Total current liabilities .................................... 2,570,319 2,420,323
Long-term debt, less current maturities ........................... 6,141,773 6,034,525
Lease financing obligations, less current maturities ................... 107,007 122,295
Other noncurrent liabilities .................................... 1,131,948 1,190,074
Total liabilities .......................................... 9,951,047 9,767,217
Commitments and contingencies ................................ — —
Stockholders’ deficit:
Preferred stock—series G, par value $1 per share; liquidation value $100
per share; 2,000 shares authorized; shares issued .006 and .006 ....... 1 1
Preferred stock—series H, par value $1 per share; liquidation value $100
per share; 2,000 shares authorized; shares issued 1,715 and 1,616 ..... 171,569 161,650
Common stock, par value $1 per share; 1,500,000 shares authorized;
shares issued and outstanding 898,687 and 890,297 ............... 898,687 890,297
Additional paid-in capital ..................................... 4,278,988 4,281,623
Accumulated deficit ......................................... (7,883,367) (7,514,796)
Accumulated other comprehensive loss ........................... (52,634) (30,142)
Total stockholders’ deficit .................................. (2,586,756) (2,211,367)
Total liabilities and stockholders’ deficit ....................... $7,364,291 $ 7,555,850
The accompanying notes are an integral part of these consolidated financial statements.
64