Rite Aid 2012 Annual Report Download - page 26
Download and view the complete annual report
Please find page 26 of the 2012 Rite Aid annual report below. You can navigate through the pages in the report by either clicking on the pages listed below, or by using the keyword search tool below to find specific information within the annual report.-
 1
1 -
2
-
3
-
4
-
5
-
6
-
7
-
8
-
9
-
10
-
11
-
12
-
13
-
14
-
15
-
 16
16 -
 17
17 -
 18
18 -
 19
19 -
 20
20 -
 21
21 -
 22
22 -
 23
23 -
 24
24 -
 25
25 -
 26
26 -
 27
27 -
 28
28 -
 29
29 -
 30
30 -
 31
31 -
 32
32 -
 33
33 -
 34
34 -
 35
35 -
 36
36 -
37
-
38
-
39
-
40
-
41
-
42
-
43
-
44
-
45
-
46
-
47
-
48
-
49
-
50
-
51
-
52
-
53
-
54
-
55
-
56
-
57
-
58
-
59
-
60
-
61
-
62
-
63
-
64
-
65
-
66
-
67
-
68
-
69
-
70
-
71
-
72
-
73
-
74
-
75
-
76
-
77
-
78
-
79
-
80
-
81
-
82
-
83
-
84
-
85
-
86
-
87
-
88
-
89
-
90
-
91
-
92
-
93
-
94
-
95
-
96
-
97
-
98
-
99
-
100
-
101
-
102
-
103
-
104
-
105
-
106
-
107
-
108
-
109
-
110
-
111
-
112
-
113
-
114
-
115
-
116
-
117
-
118
-
119
-
120
-
121
-
122
-
123
-
124
-
125
-
126
 |
 |

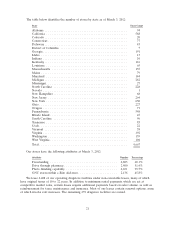
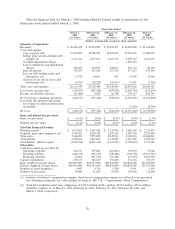
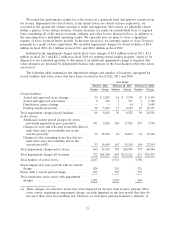
Selected financial data for March 1, 2008 includes Brooks Eckerd results of operations for the
thirty-nine week period ended March 1, 2008.
Fiscal Year Ended
March 3, February 26, February 27, February 28, March 1,
2012 2011 2010 2009 2008
(53 weeks) (52 weeks) (52 weeks) (52 weeks) (52 weeks)
(Dollars in thousands, except per share amounts)
Summary of Operations:
Revenues ................... $26,121,222 $ 25,214,907 $ 25,669,117 $ 26,289,268 $ 24,326,846
Costs and expense:
Cost of goods sold ........... 19,327,887 18,522,403 18,845,027 19,253,616 17,689,272
Selling, general and administrative
expenses(1) ............... 6,531,411 6,457,833 6,603,372 6,985,367 6,366,137
Goodwill impairment charge ..... — — — 1,810,223 —
Lease termination and impairment
charges ................. 100,053 210,893 208,017 293,743 86,166
Interest expense ............. 529,255 547,581 515,763 477,627 449,596
Loss on debt modifications and
retirements, net ............ 33,576 44,003 993 39,905 12,900
(Gain) loss on sale of assets and
investments, net ............ (8,703) (22,224) (24,137) 11,581 (3,726)
Total costs and expenses ......... 26,513,479 25,760,489 26,149,035 28,872,062 24,600,345
Loss before income taxes ........ (392,257) (545,582) (479,918) (2,582,794) (273,499)
Income tax (benefit) expense ...... (23,686) 9,842 26,758 329,257 802,701
Net loss from continuing operations . (368,571) (555,424) (506,676) (2,912,051) (1,076,200)
Loss from discontinued operations,
net of gain on disposal and income
tax benefit ................. — — — (3,369) (2,790)
Net loss .................... $ (368,571) $ (555,424) $ (506,676) $ (2,915,420) $ (1,078,990)
Basic and diluted loss per share:
Basic loss per share ............ $ (0.43) $ (0.64) $ (0.59) $ (3.49) $ (1.54)
Diluted loss per share ........... $ (0.43) $ (0.64) $ (0.59) $ (3.49) $ (1.54)
Year-End Financial Position:
Working capital ............... $ 1,934,267 $ 1,991,042 $ 2,332,976 $ 2,062,505 $ 2,123,855
Property, plant and equipment, net . . 1,902,021 2,039,383 2,293,153 2,587,356 2,873,009
Total assets .................. 7,364,291 7,555,850 8,049,911 8,326,540 11,488,023
Total debt(2) ................. 6,328,201 6,219,865 6,370,899 6,011,709 5,985,524
Stockholders’ (deficit) equity ...... (2,586,756) (2,211,367) (1,673,551) (1,199,652) 1,711,185
Other Data:
Cash flows (used in) provided by:
Operating activities ........... 266,537 395,849 (325,063) 359,910 79,368
Investing activities ............ (221,169) (156,677) (120,486) (346,358) (2,933,744)
Financing activities ........... 25,801 (251,650) 397,108 (17,279) 2,903,990
Capital expenditures ............ 250,137 186,520 193,630 541,346 740,375
Basic weighted average shares ..... 885,819,000 882,947,000 880,843,000 840,812,000 723,923,000
Diluted weighted average shares . . . 885,819,000 882,947,000 880,843,000 840,812,000 723,923,000
Number of retail drugstores ....... 4,667 4,714 4,780 4,901 5,059
Number of associates ........... 90,000 91,800 97,500 103,000 112,800
(1) Includes stock-based compensation expense. Stock based compensation expense for all fiscal years presented
was determined using the fair value method set forth in ASC 718, ‘‘Compensation—Stock Compensation.’’
(2) Total debt included capital lease obligations of $127.0 million, $140.3 million, $152.7 million, $193.8 million,
and $216.3 million, as of March 3, 2012, February 26, 2011, February 27, 2010, February 28, 2009, and
March 1, 2008, respectively.
26