Rite Aid 2012 Annual Report Download - page 40
Download and view the complete annual report
Please find page 40 of the 2012 Rite Aid annual report below. You can navigate through the pages in the report by either clicking on the pages listed below, or by using the keyword search tool below to find specific information within the annual report.-
 1
1 -
2
-
3
-
4
-
5
-
6
-
7
-
8
-
9
-
10
-
11
-
12
-
13
-
14
-
15
-
16
-
17
-
18
-
19
-
20
-
21
-
22
-
23
-
24
-
25
-
26
-
27
-
28
-
29
-
 30
30 -
 31
31 -
 32
32 -
 33
33 -
 34
34 -
 35
35 -
 36
36 -
 37
37 -
 38
38 -
 39
39 -
 40
40 -
 41
41 -
 42
42 -
 43
43 -
 44
44 -
 45
45 -
 46
46 -
 47
47 -
 48
48 -
 49
49 -
 50
50 -
51
-
52
-
53
-
54
-
55
-
56
-
57
-
58
-
59
-
60
-
61
-
62
-
63
-
64
-
65
-
66
-
67
-
68
-
69
-
70
-
71
-
72
-
73
-
74
-
75
-
76
-
77
-
78
-
79
-
80
-
81
-
82
-
83
-
84
-
85
-
86
-
87
-
88
-
89
-
90
-
91
-
92
-
93
-
94
-
95
-
96
-
97
-
98
-
99
-
100
-
101
-
102
-
103
-
104
-
105
-
106
-
107
-
108
-
109
-
110
-
111
-
112
-
113
-
114
-
115
-
116
-
117
-
118
-
119
-
120
-
121
-
122
-
123
-
124
-
125
-
126
 |
 |
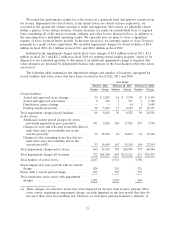
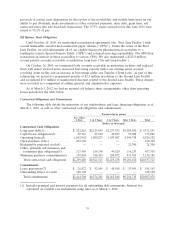
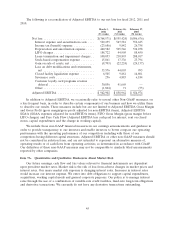
(2) Represents the minimum lease payments on non-cancelable leases, including interest, but net of
sublease income.
(3) Represents the minimum lease payments on non-cancelable leases, including interest, but net of
sublease income.
(4) Represents value of redeemable preferred stock at its redemption date.
(5) Includes the undiscounted payments for self-insured medical coverage, actuarially determined
undiscounted payments for self-insured workers’ compensation and general liability, and actuarially
determined obligations for defined benefit pension and nonqualified executive retirement plans.
(6) Represents commitments to purchase products and licensing fees from certain vendors.
(7) Represents lease guarantee obligations for 123 former stores related to certain business
dispositions. The respective purchasers assume the obligations and are, therefore, primarily liable
for these obligations.
Obligations for income tax uncertainties pursuant to ASC 740, ‘‘Income Taxes’’ of approximately
$83.8 million are not included in the table above as we are uncertain as to if or when such amounts
may be settled.
Net Cash Provided By (Used In) Operating, Investing and Financing Activities
Cash flow provided by operating activities was $266.5 million in fiscal 2012. Cash flow was
positively impacted by the reduction in net loss, an increase in accounts payable due to the timing of
purchases partially offset by an increase in inventory resulting primarily from price inflation and
increased store inventory to support sales growth.
Cash flow provided by operating activities was $395.8 million in fiscal 2011. Cash flow was
positively impacted by a reduction in inventory and an increase in accounts payable due to the timing
of purchases. Additionally, the reductions in accounts receivable were no longer offset by repayments to
the receivables securitization facility which was eliminated in the third quarter of fiscal 2010.
Cash flow used in operating activities was $325.1 million in fiscal 2010. Cash flow was negatively
impacted by the repayments of the accounts receivable securitization facilities totaling $555.0 million
and a decrease in accounts payable offset by a reduction in inventory and accounts receivable. The
decreases in accounts receivables, inventory and accounts payable were due to operating fewer stores
and various working capital initiatives.
Cash used in investing activities was $221.2 million in fiscal 2012. Cash was used for the purchase
of property, plant and equipment and prescription files which was partially offset by proceeds from
asset dispositions and sale-leaseback transactions.
Cash used in investing activities was $156.7 million in fiscal 2011. Cash was used for the purchase
of property, plant and equipment and prescription files which was partially offset by proceeds from
asset dispositions.
Cash used in investing activities was $120.5 million in fiscal 2010. Cash was used for the purchase
of property, plant and equipment and prescription files which was offset in part by proceeds from asset
dispositions.
Cash provided by financing activities was $25.8 million in fiscal 2012 and was primarily due to
increased revolver borrowings coupled with the February 2012 issuance of $481.0 million of our 9.25%
senior notes due March 15, 2020 and concurrent repurchase of $404.8 million of our 8.625% senior
notes due March 2015. The remaining $54.2 million of the 8.625% senior notes due March 2015 were
repurchased in March 2012.
40