Office Depot 2010 Annual Report Download - page 8
Download and view the complete annual report
Please find page 8 of the 2010 Office Depot annual report below. You can navigate through the pages in the report by either clicking on the pages listed below, or by using the keyword search tool below to find specific information within the annual report.-
 1
1 -
 2
2 -
 3
3 -
 4
4 -
 5
5 -
 6
6 -
 7
7 -
 8
8 -
 9
9 -
 10
10 -
 11
11 -
 12
12 -
 13
13 -
 14
14 -
 15
15 -
 16
16 -
 17
17 -
 18
18 -
 19
19 -
20
-
21
-
22
-
23
-
24
-
25
-
26
-
27
-
28
-
29
-
30
-
31
-
32
-
33
-
34
-
35
-
36
-
37
-
38
-
39
-
40
-
41
-
42
-
43
-
44
-
45
-
46
-
47
-
48
-
49
-
50
-
51
-
52
-
53
-
54
-
55
-
56
-
57
-
58
-
59
-
60
-
61
-
62
-
63
-
64
-
65
-
66
-
67
-
68
-
69
-
70
-
71
-
72
 |
 |
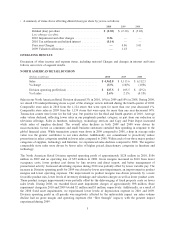
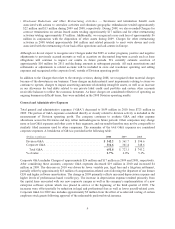
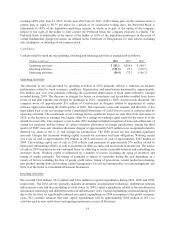
currencies increased 1% in 2010 and declined 8% in 2009. Growth in the small- to medium-sized business
customers and large national account customers offset softness in the public sector business that resulted from
various governmental austerity programs enacted throughout the year. The 2009 decrease reflects impacts from
larger businesses decreasing their workforces and their discretionary spending on office supplies. Local currency
sales in the direct business declined 5% and 11% in 2010 and 2009, respectively. The trend reflects some
improvements in sales of higher priced items such as furniture and technology. We continue to focus on
increasing the number of customer transactions. Sales in the retail channel increased after considering the impact
of store closings in Japan, begun in 2009 and completed in early 2010, as well as the fourth quarter 2010
transaction related to our stores in Israel discussed below.
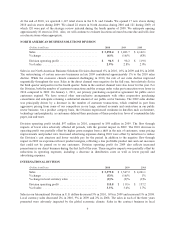
Division operating profit totaled approximately $111million in 2010, $120 million in 2009 and $157 million in
2008. Included in Division operating profit for 2010 were charges of approximately $23 million from the sale of
operating subsidiaries in Israel and Japan, as well as facility closure and severance costs associated with
consolidation arrangements in Europe. The subsidiary sales reflect the company’s decision to change its
investment model in those countries from direct operating to license arrangements. The respective buyers of the
entities will operate under the Office Depot name and the company will continue to generate cash flows from
these entities from licensing fees and product sales. The company may continue efforts to improve financial
results through efficiencies and operational consolidation during 2011. Should such activity be undertaken,
additional charges could result.
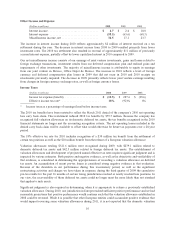
The decreases in Division operating profit in 2010, 2009 and 2008 were also impacted by the flow through
effects of lower sales levels. The operating profit comparison of 2010 to 2009 also reflects higher vendor rebates
in 2009 and higher product costs in 2010 that were not passed on to customers, partially offset by lower variable
pay. For 2009, the negative flow through impact was partially offset by lower operating expenses, including a
decrease in distribution costs as well as lower payroll and advertising expenses. Other factors, including a shift to
lower margin customers and cost increases that could not be fully passed on to our customers, negatively
impacted Division operating profit in both 2009 and 2008. During 2008, we also recorded a non-cash gain of
approximately $13 million related to the curtailment of a defined benefit pension plan in the UK and non-cash
impairment charges of approximately $11 million related to our customer list intangible assets.
For U.S. reporting, the International Division’s sales are translated into U.S. dollars at average exchange rates
experienced during the year. The Division’s reported sales were negatively impacted by approximately $80
million in 2010, $305 million in 2009 and positively impacted by $127 million in 2008 from changes in foreign
currency exchange rates. Division operating profit was negatively impacted by $3 million in 2010, $6 million in
2009 and positively impacted by $2 million in 2008 from changes in foreign exchange rates. Internally, we
analyze our international operations in terms of local currency performance to allow focus on operating trends
and results.
CORPORATE AND OTHER
Asset Impairments, Exit Costs and Other Charges
Each of our three operating segments has been adversely affected by the downturn in the global economy in
recent years. The company has taken actions to adapt to the changing and increasingly competitive conditions
including closing stores and distribution centers (“DCs”), consolidating functional activities and disposing of
businesses and assets. During 2010, 2009 and 2008, we have recognized significant charges from reorganization
efforts and asset impairments. The Charges recognized in 2009 and 2008 that related to a strategic review were
managed at the corporate level and were excluded from measurement of Division operating profit.
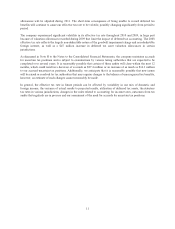
In the fourth quarter of 2010, the company initiated additional activities to improve future operating
performance, change the ownership structure of certain international investments and eliminate non-productive
corporate assets. Specifically, the company wrote off approximately $51 million of Construction In Progress
7