Office Depot 2010 Annual Report Download - page 5
Download and view the complete annual report
Please find page 5 of the 2010 Office Depot annual report below. You can navigate through the pages in the report by either clicking on the pages listed below, or by using the keyword search tool below to find specific information within the annual report.-
 1
1 -
 2
2 -
 3
3 -
 4
4 -
 5
5 -
 6
6 -
 7
7 -
 8
8 -
 9
9 -
 10
10 -
 11
11 -
 12
12 -
 13
13 -
 14
14 -
 15
15 -
 16
16 -
17
-
18
-
19
-
20
-
21
-
22
-
23
-
24
-
25
-
26
-
27
-
28
-
29
-
30
-
31
-
32
-
33
-
34
-
35
-
36
-
37
-
38
-
39
-
40
-
41
-
42
-
43
-
44
-
45
-
46
-
47
-
48
-
49
-
50
-
51
-
52
-
53
-
54
-
55
-
56
-
57
-
58
-
59
-
60
-
61
-
62
-
63
-
64
-
65
-
66
-
67
-
68
-
69
-
70
-
71
-
72
 |
 |
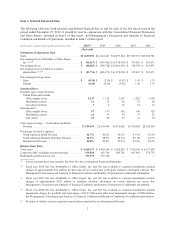
Item 7. Management’s Discussion and Analysis of Financial Condition and Results of Operations.
The following Management’s Discussion and Analysis of Financial Condition and Results of Operations has
been updated to reflect the restatement of the consolidated statements of operations, comprehensive income, cash
flows, and stockholders’ equity for the year ended December 25, 2010 and the consolidated balance sheet as of
December 25, 2010. For a more detailed description of the restatement, see Note B — Restatement of
Consolidated Financial Statements.
RESULTS OF OPERATIONS
OVERVIEW
Our business is comprised of three segments. The North American Retail Division includes our retail office
supply stores in the U.S. and Canada, which offer office supplies and services, computers and business machines
and related supplies, and office furniture. Most stores also offer a copy and print center offering printing,
reproduction, mailing and shipping. The North American Business Solutions Division sells office supply
products and services in the U.S. and Canada directly to businesses through catalogs, internet web sites and a
dedicated sales force. Our International Division sells office products and services through catalogs, internet web
sites, a dedicated sales force and retail stores.
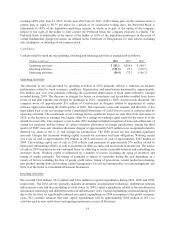
Our fiscal year results are based on a 52- or 53-week retail calendar ending on the last Saturday in December.
Each of the three years addressed in this Management’s Discussion and Analysis of Financial Condition and
Results of Operations (“MD&A”) is based on 52 weeks. Our next 53 week fiscal year will occur in 2011. Our
comparable store sales relate to stores that have been open for at least one year. A summary of factors important
to understanding our results for 2010 is provided below and further discussed in the narrative that follows this
overview.
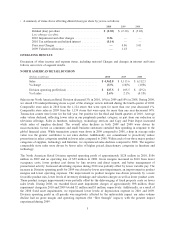
• Total company sales were $11.6 billion in 2010, down 4% compared to 2009. Sales in North America
decreased 4% for the year; comparable store sales in the North American Retail Division decreased 1%.
International Division sales decreased 5% in U.S. dollars and 2% in local currencies.
• Gross margin for 2010 improved 90 basis points from 2009, following a 30 basis point increase from 2008.
The increase in 2010 primarily reflects lower occupancy costs, better management of promotional activity and
benefits from product line reviews and increased direct imports.
• During 2010, we recognized $51 million for impairment of certain software applications, $23 million for net
losses on business dispositions, facility closure and severance costs and $13 million associated with the
departure of our former CEO and other executive compensation costs. The per share impact of these items
totaled $0.26.
• As part of our previously announced strategic reviews, we recorded charges of $253 million and $199 million
in 2009 and 2008, respectively. These expenses (the “Charges”) include primarily charges for lease accruals,
severance expenses and asset impairments. Charges under these programs ended in 2009.
• We have restated our tax benefits for 2010 following the March 2011 denial of our tax loss carry back claim.
The restatement reduced tax benefits by $79.5 million, compared to amounts previously reported. The change
in tax benefits also impacts the 2010 per share calculation of other items summarized in the table below.
• During 2010, we recognized significant tax and interest benefits from settlements with tax authorities,
resulting in a full year benefit of approximately $0.14 per share. During 2009, we recorded a non-cash tax
expense to establish valuation allowances on deferred tax assets of $321.6 million ($1.18 per share) because of
the uncertainty of future realizability of these assets.
• At the end of 2010, we had $627 million in cash and approximately $674 million available on our asset based
credit facility. Cash flow from operating activities was $200 million for 2010.
4