Office Depot 2010 Annual Report Download - page 57
Download and view the complete annual report
Please find page 57 of the 2010 Office Depot annual report below. You can navigate through the pages in the report by either clicking on the pages listed below, or by using the keyword search tool below to find specific information within the annual report.-
 1
1 -
2
-
3
-
4
-
5
-
6
-
7
-
8
-
9
-
10
-
11
-
12
-
13
-
14
-
15
-
16
-
17
-
18
-
19
-
20
-
21
-
22
-
23
-
24
-
25
-
26
-
27
-
28
-
29
-
30
-
31
-
32
-
33
-
34
-
35
-
36
-
37
-
38
-
39
-
40
-
41
-
42
-
43
-
44
-
45
-
46
-
 47
47 -
 48
48 -
 49
49 -
 50
50 -
 51
51 -
 52
52 -
 53
53 -
 54
54 -
 55
55 -
 56
56 -
 57
57 -
 58
58 -
 59
59 -
 60
60 -
 61
61 -
 62
62 -
 63
63 -
 64
64 -
 65
65 -
 66
66 -
 67
67 -
68
-
69
-
70
-
71
-
72
 |
 |

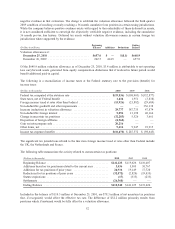
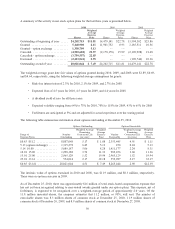
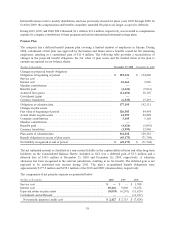
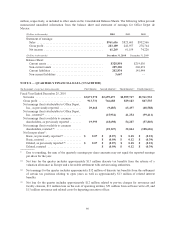
A summary of the activity in our stock option plans for the last three years is presented below.
2010 2009 2008
Shares
Weighted
Average
Exercise
Price Shares
Weighted
Average
Exercise
Price Shares
Weighted
Average
Exercise
Price
Outstanding at beginning of year ..... 24,202,715 $11.81 14,479,141 $22.78 13,594,302 $23.86
Granted ......................... 5,140,900 8.11 11,901,752 0.93 3,185,511 10.56
Granted – option exchange .......... 1,350,709 5.13 —— ——
Canceled ........................ (4,510,682) 21.57 (2,178,178) 15.99 (2,190,928) 21.48
Cancelled – option exchange ......... (3,739,557) 22.85 —— ——
Exercised ........................ (2,423,041) 0.95 — — (109,744) 10.36
Outstanding at end of year .......... 20,021,044 $ 7.49 24,202,715 $11.81 14,479,141 $22.78
The weighted-average grant date fair values of options granted during 2010, 2009, and 2008 were $3.89, $0.69,
and $4.64, respectively, using the following weighted average assumptions for grants:
• Risk-free interest rates of 2.3% for 2010, 2.1% for 2009, and 2.7% for 2008
• Expected lives of 4.5 years for 2010, 4.5 years for 2009, and 4.4 years for 2008
• A dividend yield of zero for all three years
• Expected volatility ranging from 64% to 73% for 2010, 70% to 118% for 2009, 43% to 65% for 2008
• Forfeitures are anticipated at 5% and are adjusted for actual experience over the vesting period
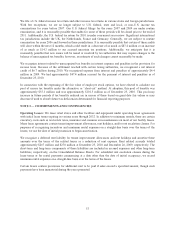
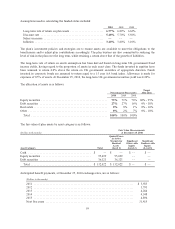
The following table summarizes information about options outstanding at December 25, 2010.
Options Outstanding Options Exercisable
Range of
Exercise Prices
Number
Outstanding
Weighted Average
Remaining
Contractual Life
(in years)
Weighted
Average
Exercise
Price
Number
Exercisable
Weighted Average
Remaining
Contractual Life
(in years)
Weighted
Average
Exercise
Price
$0.85 $5.12 .............. 8,807,048 5.17 $ 1.08 2,353,445 4.91 $ 1.11
5.13 (option exchange) ...... 1,315,278 6.45 5.13 250 0.24 5.13
5.14 10.00 ............... 5,089,187 5.06 8.28 1,411,177 2.24 8.31
10.01 15.00 .............. 1,290,388 3.74 11.33 982,456 3.60 11.36
15.01 25.00 .............. 2,965,129 1.52 19.94 2,965,129 1.52 19.94
25.01 33.61 .............. 554,014 2.17 32.18 552,987 2.17 32.17
$0.85 $33.61 ............. 20,021,044 4.51 $ 7.49 8,265,444 2.90 $12.39
The intrinsic value of options exercised in 2010 and 2008, was $11.9 million, and $0.3 million, respectively.
There were no option exercises in 2009.
As of December 25, 2010, there was approximately $16 million of total stock-based compensation expense that
has not yet been recognized relating to non-vested awards granted under our option plans. This expense, net of
forfeitures, is expected to be recognized over a weighted-average period of approximately 2.0 years. Of the
11.8 million unvested shares, the company estimates that 11.2 million, or 95%, will vest. The number of
exercisable shares was 8.3 million shares of common stock at December 25, 2010, 11.9 million shares of
common stock at December 26, 2009, and 8.9 million shares of common stock at December 27, 2008.
56