Office Depot 2010 Annual Report Download - page 7
Download and view the complete annual report
Please find page 7 of the 2010 Office Depot annual report below. You can navigate through the pages in the report by either clicking on the pages listed below, or by using the keyword search tool below to find specific information within the annual report.-
 1
1 -
 2
2 -
 3
3 -
 4
4 -
 5
5 -
 6
6 -
 7
7 -
 8
8 -
 9
9 -
 10
10 -
 11
11 -
 12
12 -
 13
13 -
 14
14 -
 15
15 -
 16
16 -
 17
17 -
 18
18 -
19
-
20
-
21
-
22
-
23
-
24
-
25
-
26
-
27
-
28
-
29
-
30
-
31
-
32
-
33
-
34
-
35
-
36
-
37
-
38
-
39
-
40
-
41
-
42
-
43
-
44
-
45
-
46
-
47
-
48
-
49
-
50
-
51
-
52
-
53
-
54
-
55
-
56
-
57
-
58
-
59
-
60
-
61
-
62
-
63
-
64
-
65
-
66
-
67
-
68
-
69
-
70
-
71
-
72
 |
 |

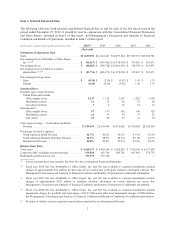
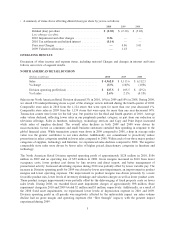
At the end of 2010, we operated 1,147 retail stores in the U.S. and Canada. We opened 17 new stores during
2010 and six stores during 2009. We closed 22 stores in North America during 2010 and 121 during 2009, of
which 120 were part of the strategic review initiated during the fourth quarter of 2008. We anticipate opening
approximately 10 stores in 2011. Also, we will continue to evaluate locations as leases become due and will close
or relocate stores when appropriate.
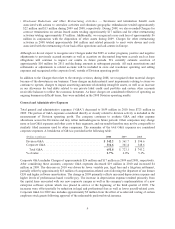
NORTH AMERICAN BUSINESS SOLUTIONS DIVISION
(Dollars in millions) 2010 2009 2008
Sales ......................................... $ 3,290.4 $ 3,483.7 $ 4,142.1
% change ...................................... (6)% (16)% (8)%
Division operating profit .......................... $ 96.5 $ 98.2 $ 119.8
% of sales ..................................... 2.9% 2.8% 2.9%
Sales in our North American Business Solutions Division decreased 6% in 2010, 16% in 2009 and 8% in 2008.
The restructuring of certain non-core businesses in late 2009 contributed approximately 1% to the 2010 sales
decline. While the economic climate remained challenging in 2010, the rate of our sales decline improved
sequentially throughout the year. Sales in the direct channel were negative for the full year, but relatively flat in
the third quarter and positive in the fourth quarter. Sales in the contract channel were also lower for the year. For
the Division, both the number of customer transactions and the average order value per transaction were lower in
2010 compared to 2009. On January 1, 2011, our primary purchasing cooperative agreement for public sector
customers expired. We have several other non-exclusive arrangements with other cooperative purchasing
consortiums and anticipate retaining a substantial amount of our public sector business. The 2009 sales decline
was principally driven by a decrease in the number of customer transactions, which resulted in part from
aggressive pricing from some of our competitors in our large, national accounts and contraction in our public
sector business. On a product category basis, the Division experienced weakness in durables such as furniture,
technology and peripherals, as customers delayed their purchases of these products in favor of consumables like
paper, ink and toner.
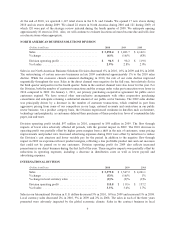
Division operating profit totaled $97 million in 2010, compared to $98 million in 2009. The flow through
impacts of lower sales adversely affected all periods, with the greatest impact in 2009. The 2010 decrease in
operating profit was partially offset by higher gross margins from a shift in the mix of customers, some pricing
improvements and product mix. Increased advertising expenses during 2010 were offset by initiatives to reduce
the Division’s cost structure and lower variable pay for the period. In addition to the negative flow through
impact in 2009 we experienced lower product margins, reflecting a less profitable product mix and cost increases
that could not be passed on to our customers. Division operating profit for 2009 also reflects increased
promotions in our direct business during the first half of the year. These negative impacts were partially offset by
reductions in operating expenses, including a decrease in distribution costs as well as lower payroll and
advertising expenses.
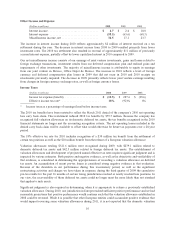
INTERNATIONAL DIVISION
(Dollars in millions) 2010 2009 2008
Sales ......................................... $ 3,379.8 $ 3,547.2 $ 4,241.1
% change ...................................... (5)% (16)% 1%
% change in local currency sales ................... (2)% (9)% (2)%
Division operating profit .......................... 110.8 $ 119.6 $ 157.2
% of sales ..................................... 3.3% 3.4% 3.7%
Sales in our International Division in U.S. dollars decreased 5% in 2010, 16% in 2009 and increased 1% in 2008.
Local currency sales decreased 2% in 2010, 9% in 2009 and 2% in 2008. The sales in each of the three years
presented were adversely impacted by the global economic climate. Sales in the contract business in local
6