Office Depot 2010 Annual Report Download - page 65
Download and view the complete annual report
Please find page 65 of the 2010 Office Depot annual report below. You can navigate through the pages in the report by either clicking on the pages listed below, or by using the keyword search tool below to find specific information within the annual report.-
 1
1 -
2
-
3
-
4
-
5
-
6
-
7
-
8
-
9
-
10
-
11
-
12
-
13
-
14
-
15
-
16
-
17
-
18
-
19
-
20
-
21
-
22
-
23
-
24
-
25
-
26
-
27
-
28
-
29
-
30
-
31
-
32
-
33
-
34
-
35
-
36
-
37
-
38
-
39
-
40
-
41
-
42
-
43
-
44
-
45
-
46
-
47
-
48
-
49
-
50
-
51
-
52
-
53
-
54
-
 55
55 -
 56
56 -
 57
57 -
 58
58 -
 59
59 -
 60
60 -
 61
61 -
 62
62 -
 63
63 -
 64
64 -
 65
65 -
 66
66 -
 67
67 -
 68
68 -
 69
69 -
 70
70 -
 71
71 -
 72
72
 |
 |

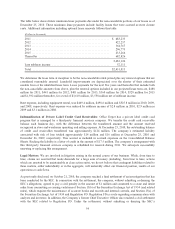
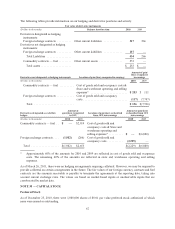
NOTE O — SUPPLEMENTAL INFORMATION ON OPERATING, INVESTING AND FINANCING
ACTIVITIES
Additional supplemental information related to the Consolidated Statements of Cash Flows is as follows:
(Dollars in thousands) 2010 2009 2008
Cash interest paid (net of amounts capitalized) .................... $62,352 $ 52,631 $ 55,208
Cash taxes paid (refunded) ................................... (54,459) (28,320) 18,848
Non-cash asset additions under capital leases ..................... 13,251 1,813 197,912
Non-cash paid-in-kind dividends (see Note C) .................... — 30,506 —
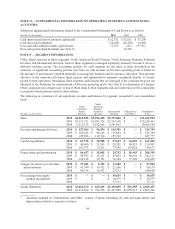
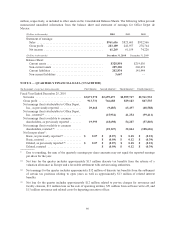
NOTE P — SEGMENT INFORMATION
Office Depot operates in three segments: North American Retail Division, North American Business Solutions
Division, and International Division. Each of these segments is managed separately primarily because it serves a
different customer group. The accounting policies for each segment are the same as those described in the
summary of significant accounting policies (see Note A). Our measure of Division operating profit is based on
the measure of performance reported internally to manage the business and for resource allocation. This measure
allocates to the respective Divisions those general and administrative expenses considered directly or closely
related to their operations. Remaining G&A expenses and Charges that are managed at the corporate level are not
allocated to the Divisions for measurement of Division operating profit. See Note D for discussion of Charges.
Other companies may charge more or less of these items to their segments and our results may not be comparable
to similarly titled measures used by other entities.
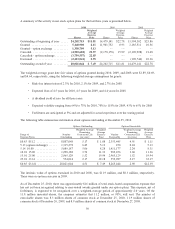
The following is a summary of our significant accounts and balances by segment, reconciled to our consolidated
totals.
(Dollars in thousands)
North
American
Retail
Division
North
American
Business
Solutions
Division
International
Division
Eliminations
and Other*
Consolidated
Total
Sales ........................ 2010 $4,962,838 $3,290,430 $3,379,826 $ — $11,633,094
2009 $5,113,553 $3,483,724 $3,547,190 $ — $12,144,467
2008 6,112,335 4,142,146 4,241,063 — 14,495,544
Division operating profit (loss) .... 2010 $ 127,504 $ 96,474 $ 110,781 $ — $ 334,759
2009 $ 105,542 $ 98,163 $ 119,604 $ — $ 323,309
2008 (29,221) 119,766 157,232 — 247,777
Capital expenditures ............ 2010 $ 67,172 $ 38,588 $ 27,637 $ 36,055 $ 169,452
2009 $ 40,600 $ 21,145 $ 20,281 $ 48,821 $ 130,847
2008 103,973 9,215 77,859 139,028 330,075
Depreciation and amortization .... 2010 $ 86,657 $ 15,005 $ 24,712 $ 81,945 $ 208,319
2009 $ 90,973 $ 15,471 $ 29,032 $ 88,639 $ 224,115
2008 126,212 19,745 30,744 77,398 254,099
Charges for losses on receivables
and inventories ..............
2010 $ 37,681 $ 8,463 $ 11,680 $ — $ 57,824
2009 $ 41,740 $ 16,932 $ 21,506 $ — $ 80,178
2008 80,354 36,471 23,233 — 140,058
Net earnings from equity
method investments .........
2010 $ — $ — $ 30,635 $ — $ 30,635
2009 $ — $ — $ 30,579 $ — $ 30,579
2008 — — 37,113 — 37,113
Assets (Restated) ............... 2010 $1,604,274 $ 663,049 $1,425,855 $ 876,259 $ 4,569,437
2009 $1,619,854 $ 726,296 $1,493,985 $1,050,211 $ 4,890,346
* Amounts included in “Eliminations and Other” consist of assets (including all cash and equivalents) and
depreciation related to corporate activities.
64