Office Depot 2010 Annual Report Download - page 63
Download and view the complete annual report
Please find page 63 of the 2010 Office Depot annual report below. You can navigate through the pages in the report by either clicking on the pages listed below, or by using the keyword search tool below to find specific information within the annual report.-
 1
1 -
2
-
3
-
4
-
5
-
6
-
7
-
8
-
9
-
10
-
11
-
12
-
13
-
14
-
15
-
16
-
17
-
18
-
19
-
20
-
21
-
22
-
23
-
24
-
25
-
26
-
27
-
28
-
29
-
30
-
31
-
32
-
33
-
34
-
35
-
36
-
37
-
38
-
39
-
40
-
41
-
42
-
43
-
44
-
45
-
46
-
47
-
48
-
49
-
50
-
51
-
52
-
 53
53 -
 54
54 -
 55
55 -
 56
56 -
 57
57 -
 58
58 -
 59
59 -
 60
60 -
 61
61 -
 62
62 -
 63
63 -
 64
64 -
 65
65 -
 66
66 -
 67
67 -
 68
68 -
 69
69 -
 70
70 -
 71
71 -
 72
72
 |
 |

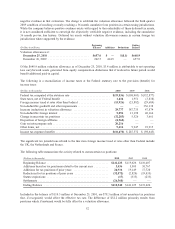
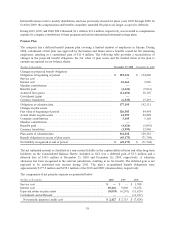
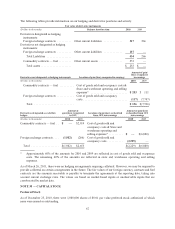
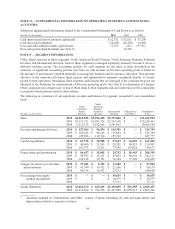
The following tables provide information on our hedging and derivative positions and activity.
Fair value of derivative instruments
(Dollars in thousands) Balance sheet location 2010 2009
Derivatives designated as hedging
instruments:
Foreign exchange contracts .......... Other current liabilities ............. 317 266
Derivatives not designated as hedging
instruments:
Foreign exchange contracts .......... Other current liabilities ............. 117 —
Total Liabilities ................. 434 266
Commodity contracts — fuel ......... Other current assets ................ 253 —
Total assets ..................... $ 253 $ —
Derivatives not designated as hedging instruments Location of gain/(loss) recognized in earnings
Amount of gain/
(loss) recognized
in earnings
(Dollars in thousands) 2010 2009
Commodity contracts — fuel .......... Cost of goods sold and occupancy costs &
Store and warehouse operating and selling
expenses* ......................... $ 253 $ 111
Foreign exchange contracts ............ Cost of goods sold and occupancy
costs .............................. (117) (7,707)
Total ........................... $ 136 $(7,596)
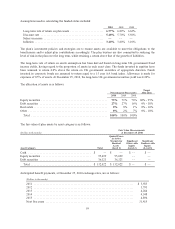
Derivatives designated as cash flow
hedges:
Amount of
gain/(loss) recognized
in OCI
Location of gain/(loss) reclassified
from OCI into earnings
Amount of gain/(loss)
reclassified from OCI
into earnings
(Dollars in thousands) 2010 2009 2010 2009
Commodity contracts — fuel . . $—$2,919 Cost of goods sold and
occupancy costs & Store and
warehouse operating and
selling expenses* .......... $—$(6,800)
Foreign exchange contracts .... (1,982) (266) Cost of goods sold and
occupancy costs ........... (2,229) —
Total ................... $(1,982) $2,653 $(2,229) $(6,800)
* Approximately 60% of the amounts for 2010 and 2009 are reflected in cost of goods sold and occupancy
costs. The remaining 40% of the amounts are reflected in store and warehouse operating and selling
expenses.
As of March 26, 2011, there were no hedging arrangements requiring collateral. However, we may be required to
provide collateral on certain arrangements in the future. The fair values of our foreign currency contracts and fuel
contracts are the amounts receivable or payable to terminate the agreements at the reporting date, taking into
account current exchange rates. The values are based on market-based inputs or unobservable inputs that are
corroborated by market data.
NOTE M — CAPITAL STOCK
Preferred Stock
As of December 25, 2010, there were 1,000,000 shares of $0.01 par value preferred stock authorized of which
none were issued or outstanding.
62