Office Depot 2009 Annual Report Download - page 79
Download and view the complete annual report
Please find page 79 of the 2009 Office Depot annual report below. You can navigate through the pages in the report by either clicking on the pages listed below, or by using the keyword search tool below to find specific information within the annual report.-
 1
1 -
2
-
3
-
4
-
5
-
6
-
7
-
8
-
9
-
10
-
11
-
12
-
13
-
14
-
15
-
16
-
17
-
18
-
19
-
20
-
21
-
22
-
23
-
24
-
25
-
26
-
27
-
28
-
29
-
30
-
31
-
32
-
33
-
34
-
35
-
36
-
37
-
38
-
39
-
40
-
41
-
42
-
43
-
44
-
45
-
46
-
47
-
48
-
49
-
50
-
51
-
52
-
53
-
54
-
55
-
56
-
57
-
58
-
59
-
60
-
61
-
62
-
63
-
64
-
65
-
66
-
67
-
68
-
 69
69 -
 70
70 -
 71
71 -
 72
72 -
 73
73 -
 74
74 -
 75
75 -
 76
76 -
 77
77 -
 78
78 -
 79
79 -
 80
80 -
 81
81 -
 82
82 -
 83
83 -
 84
84 -
 85
85 -
 86
86 -
 87
87 -
 88
88 -
 89
89 -
90
-
91
-
92
-
93
-
94
-
95
 |
 |

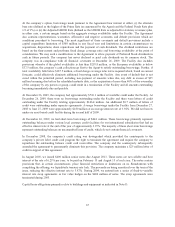
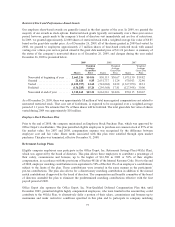
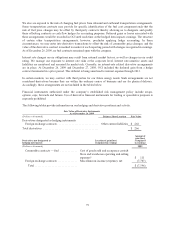
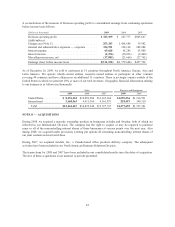
change in deferred amounts reflects an actuarial loss during the period, partially offset by investment returns
greater than assumed. The pre-tax and after-tax deferred gains at December 29, 2007 were $22.4 million and
$17.1 million, respectively. The plan’s accumulated benefit obligations were approximately $192.1 million and
$154.8 million at the 2009 and 2008 valuation dates, respectively.
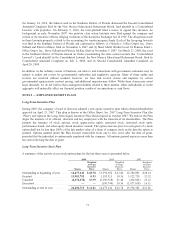
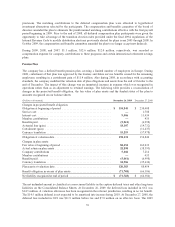
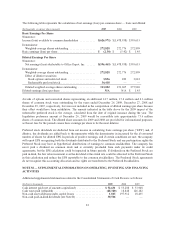
The components of net periodic expense are presented below:
(Dollars in thousands) 2009 2008 2007
Service cost .............................................. $—$ 1,708 $ 4,477
Interest cost .............................................. 9,006 13,434 11,650
Expected return on plan assets ............................... (6,291) (11,629) (8,953)
Curtailment and settlement .................................. —(11,437) —
Net periodic pension (credit) cost ........................... $ 2,715 $ (7,924) $ 7,174
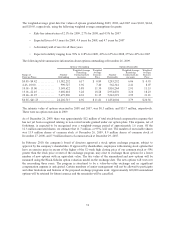
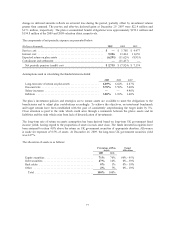
Assumptions used in calculating the funded status included:
2009 2008 2007
Long-term rate of return on plan assets .................... 6.89% 6.62% 6.87%
Discount rate ........................................ 5.70% 5.50% 5.40%
Salary increases ...................................... —— 4.40%
Inflation ............................................ 3.80% 3.10% 3.40%
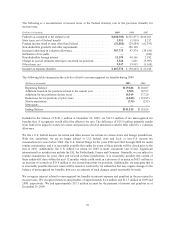
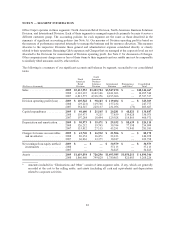
The plan’s investment policies and strategies are to ensure assets are available to meet the obligations to the
beneficiaries and to adjust plan contributions accordingly. To achieve the objectives, an investment benchmark
and target returns have been established with the goal of consistently outperforming the target index by 1%.
Close attention is paid to the risks which could arise through a mismatch between the plan’s assets and its
liabilities and the risks which arise form lack of diversification of investments.
The long-term rate of return on assets assumption has been derived based on long-term UK government fixed
income yields, having regard to the proportion of assets in each asset class. The funds invested in equities have
been assumed to return 4.0% above the return on UK government securities of appropriate duration. Allowance
is made for expenses of 0.5% of assets. At December 26, 2009, the long-term UK government securities yield
was 4.47%.
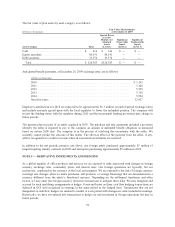
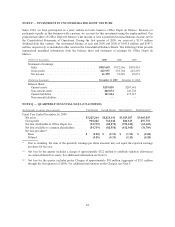
The allocation of assets is as follows:
Percentage of Plan
Assets
Target
Allocation
2009 2008
Equity securities .................................. 71% 76% 60% - 95%
Debt securities ................................... 27% 16% 0% - 30%
Real estate ...................................... 0% 1% 0% - 10%
Other .......................................... 2% 7% 0% - 10%
Total ......................................... 100% 100%
77