Office Depot 2009 Annual Report Download - page 26
Download and view the complete annual report
Please find page 26 of the 2009 Office Depot annual report below. You can navigate through the pages in the report by either clicking on the pages listed below, or by using the keyword search tool below to find specific information within the annual report.-
 1
1 -
2
-
3
-
4
-
5
-
6
-
7
-
8
-
9
-
10
-
11
-
12
-
13
-
14
-
15
-
 16
16 -
 17
17 -
 18
18 -
 19
19 -
 20
20 -
 21
21 -
 22
22 -
 23
23 -
 24
24 -
 25
25 -
 26
26 -
 27
27 -
 28
28 -
 29
29 -
 30
30 -
 31
31 -
 32
32 -
 33
33 -
 34
34 -
 35
35 -
 36
36 -
37
-
38
-
39
-
40
-
41
-
42
-
43
-
44
-
45
-
46
-
47
-
48
-
49
-
50
-
51
-
52
-
53
-
54
-
55
-
56
-
57
-
58
-
59
-
60
-
61
-
62
-
63
-
64
-
65
-
66
-
67
-
68
-
69
-
70
-
71
-
72
-
73
-
74
-
75
-
76
-
77
-
78
-
79
-
80
-
81
-
82
-
83
-
84
-
85
-
86
-
87
-
88
-
89
-
90
-
91
-
92
-
93
-
94
-
95
 |
 |

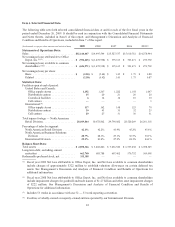
OPERATING RESULTS
Our overall sales decreased 16% in 2009, and 7% in 2008, and increased 3% in 2007. Adverse economic
conditions throughout our sales territories contributed to the declines for 2008 and 2009. The 2007 sales increase
was driven by higher U.S. dollar sales in the International Division.
The increase in gross profit as a percentage of sales in 2009 resulted primarily from improved product margins
and lower levels of inventory shrink and valuation charges partially offset by the deleveraging of fixed property
costs on lower sales levels. Gross margins in 2008 reflect significant deleveraging of fixed property cost on lower
sales as well as the impact of a highly promotional environment. An increase in private brand sales and a shift to
core supplies benefited gross margin in 2008.
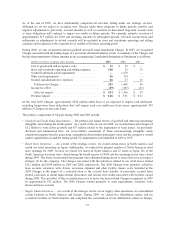
Total operating expenses as a percentage of sales was 30.1% in 2009, 38.3% in 2008 and 25.9% in 2007. The
2009, 2008 and 2007 amounts include Charges of $240 million, $183 million and $40 million, respectively. The
2008 amount also includes goodwill and trade name impairment charges of $1.3 billion and operational asset
impairments of $109 million. After considering these charges, the remaining 2008 operating expenses were
approximately 60 basis points lower than in 2009 and 190 basis points higher than in 2007. The 2009 and 2008
changes reflect the impact of relatively fixed levels of labor costs on a declining sales base. The 2009 change also
includes the deleveraging of fixed distribution costs on lower sales while the 2008 change reflects increases in
legal and professional fees and the impact of no bonus expense in 2007.
Discussion of other income and expense items, including material Charges and changes in interest and taxes
follows our review of segment results.
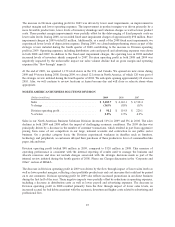
NORTH AMERICAN RETAIL DIVISION
(Dollars in millions) 2009 2008 2007
Sales ........................................ $ 5,113.6 $ 6,112.3 $ 6,813.6
% change ..................................... (16)% (10)% —%
Division operating profit (loss) .................... $ 105.5 $ (29.2) $ 354.5
% of sales .................................... 2.1% (0.5)% 5.2%
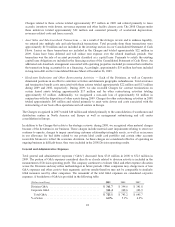
Sales in our North American Retail Division decreased 16% in 2009 and 10% in 2008. During 2009, we closed
120 underperforming stores as part of the strategic review initiated during the fourth quarter of 2008.
Comparable store sales in 2009 from the 1,139 stores that were open for more than one year decreased 14%.
Comparable store sales in 2008 from the 1,207 stores that were open for more than one year decreased 13% for
the full year and showed successive declines throughout each quarter of the year. The sales declines in both 2009
and 2008 were driven by macroeconomic factors as consumers and small business customers curtailed their
spending in response to the global financial crisis that began in 2008. While transaction counts were down in
2009, a drop in average order value was the greater contributor to our sales decline. Additionally, our
commitment to proactively reduce promotions in select categories resulted in lower sales compared to 2008.
Within each of our three major product categories of supplies, technology and furniture, we experienced sales
declines compared to 2008. The negative comparable store sales were driven by fewer sales of higher priced,
discretionary categories in furniture and technology.
The North American Retail Division reported operating profit of approximately $106 million in 2009, compared
to an operating loss of $29 million in 2008. This measure of operating performance is consistent with the internal
reporting of results used to manage the business and allocate resources and does not include charges associated
with the strategic decisions made as part of the internal review initiated during the fourth quarter of 2008. Please
see Charges discussion in the “Corporate and Other” section of MD&A.
24